An EEG and behavioural study of affective response to old versus new public housing in Hong Kong.
Alina Viven Shults Master of Urban Design — The University of Hong Kong
Supervisor Dr. Alice Vialard · Co-supervisor Dr. Waishan Qiu Advisor Dr. Bin Jiang
The question behind the question
A building that simply felt more alive.
A personal beginning
People weren't there — yet their traces were everywhere. And it felt good.
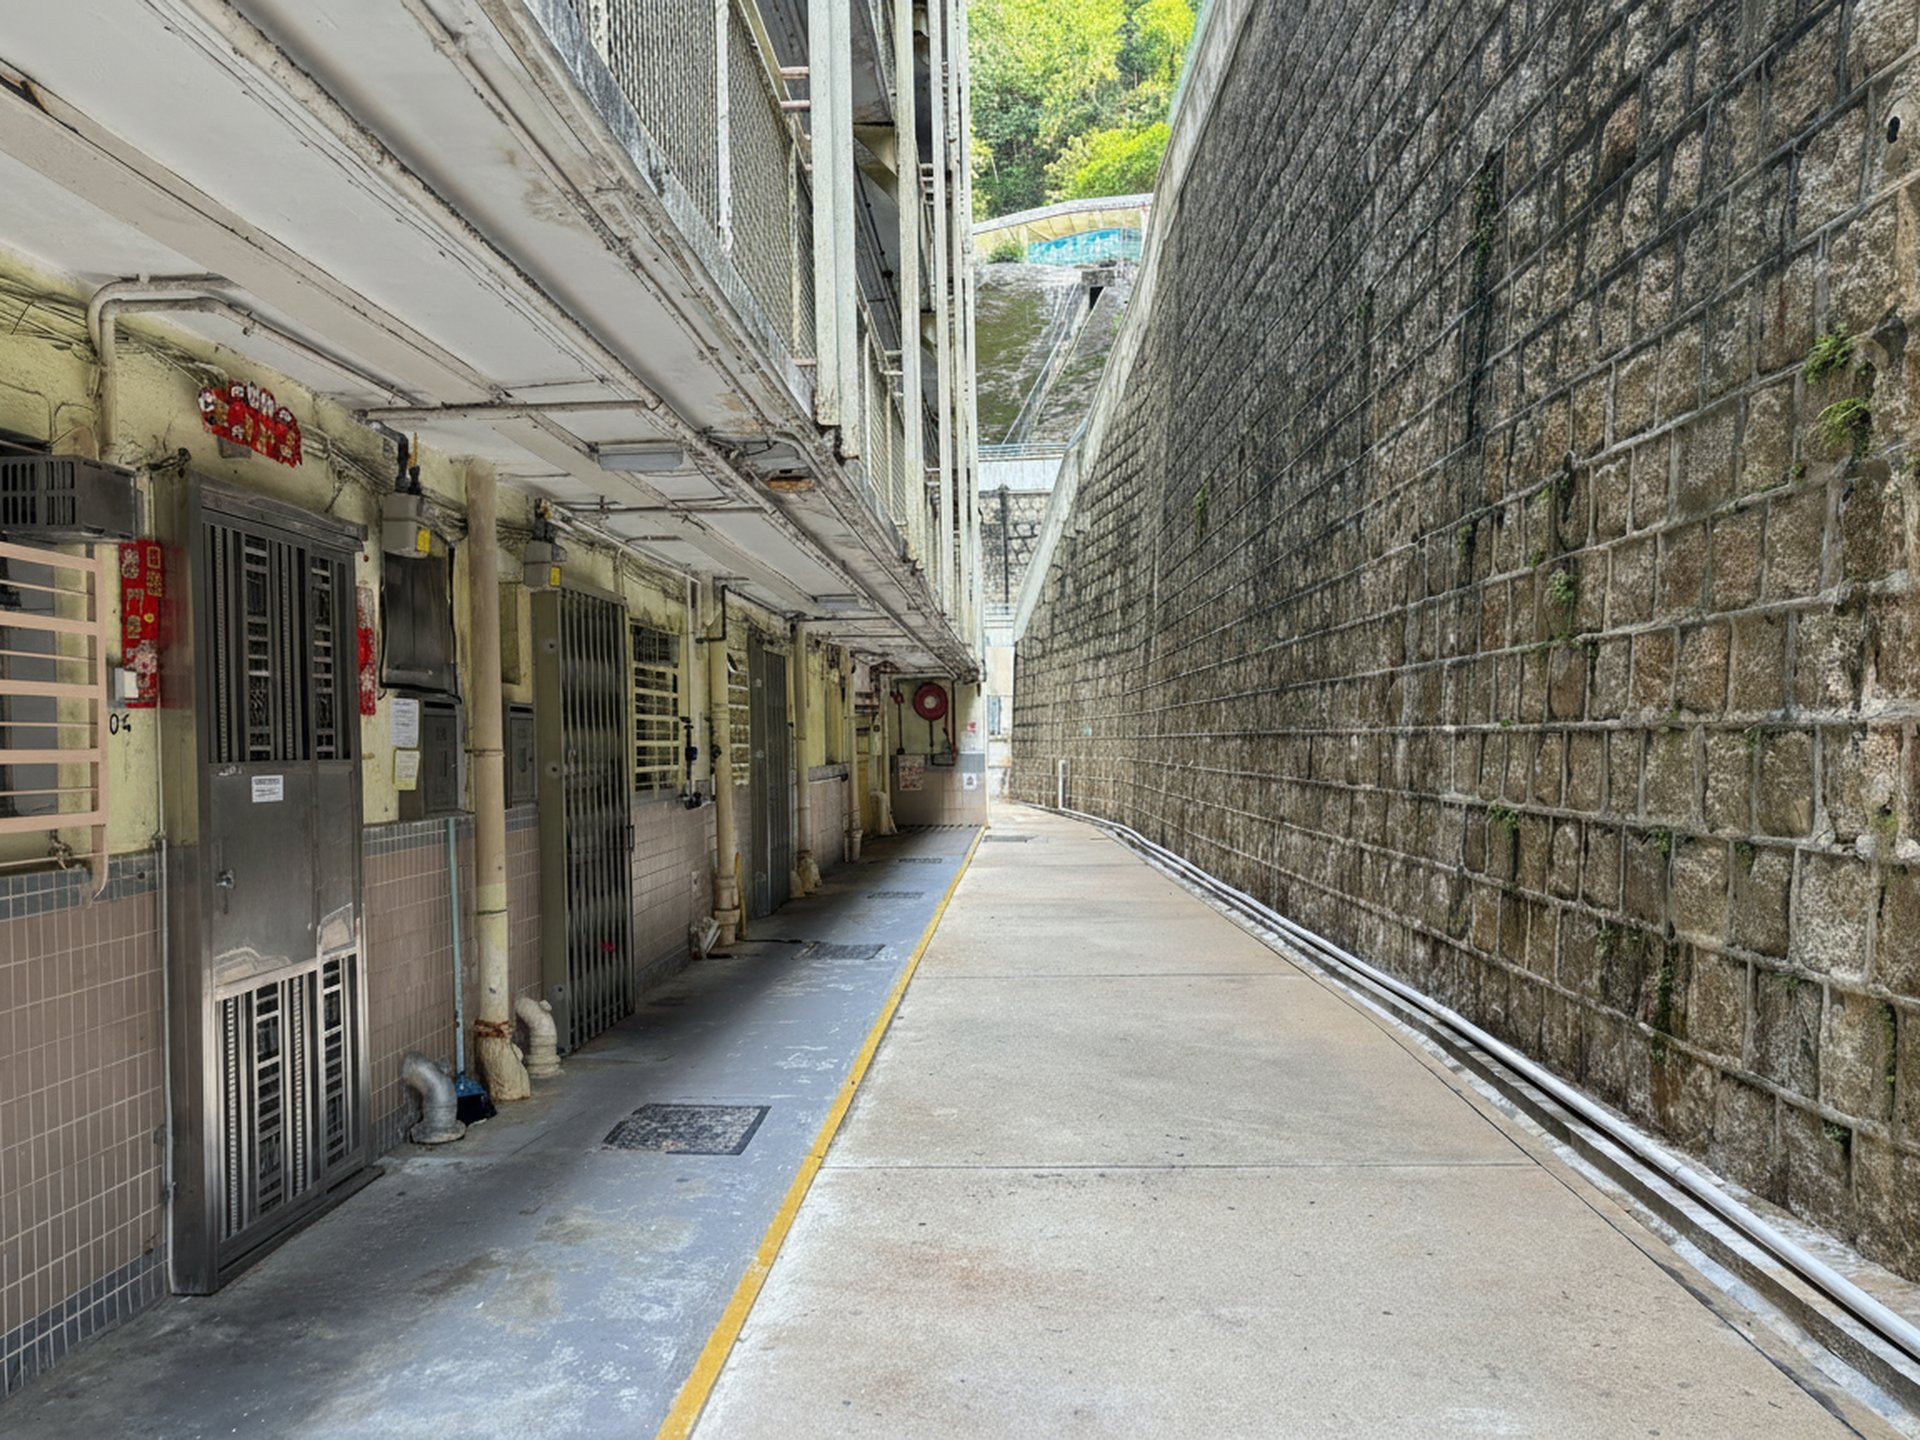
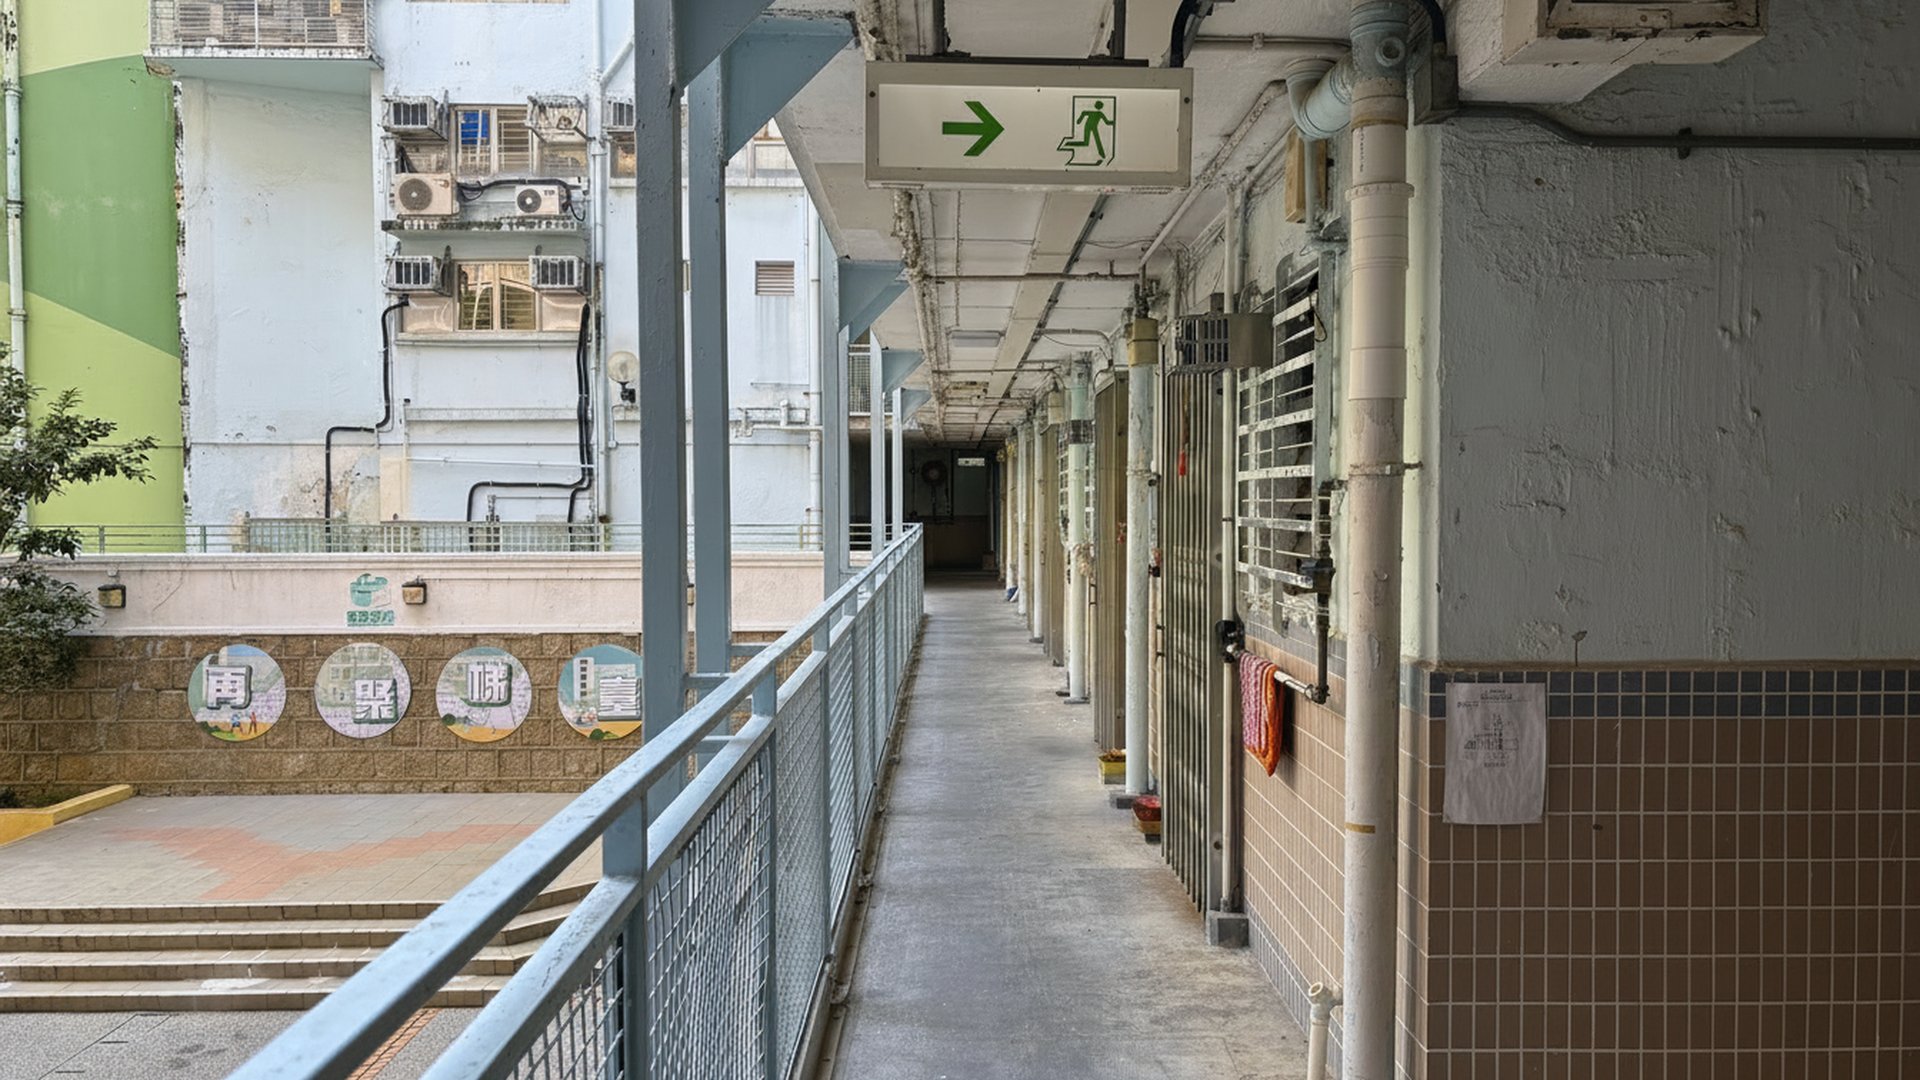
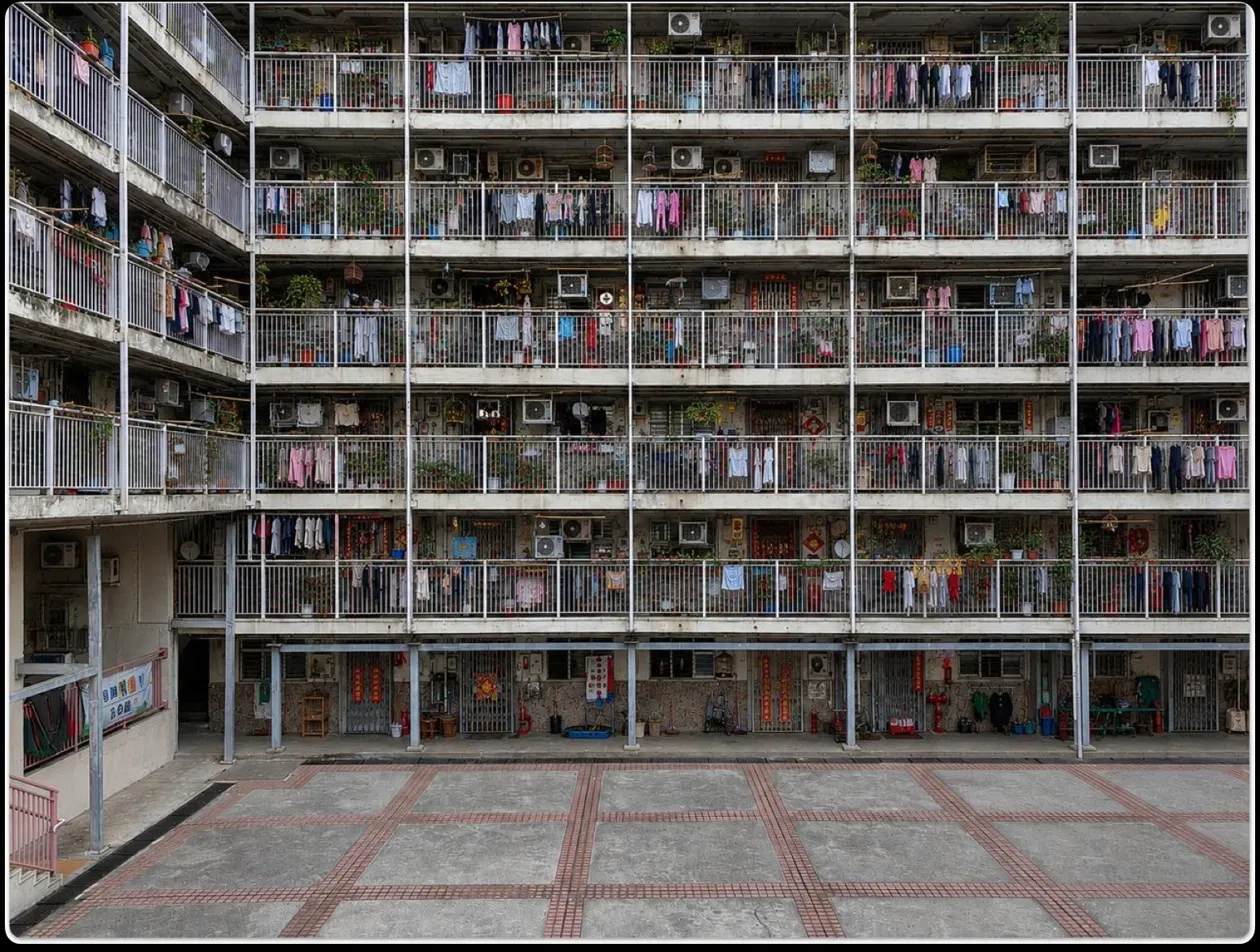
One evening I visited one of Hong Kong's oldest functioning housing estates — soon to be demolished. It felt better to me than many polished new developments. Not nicer. More alive.
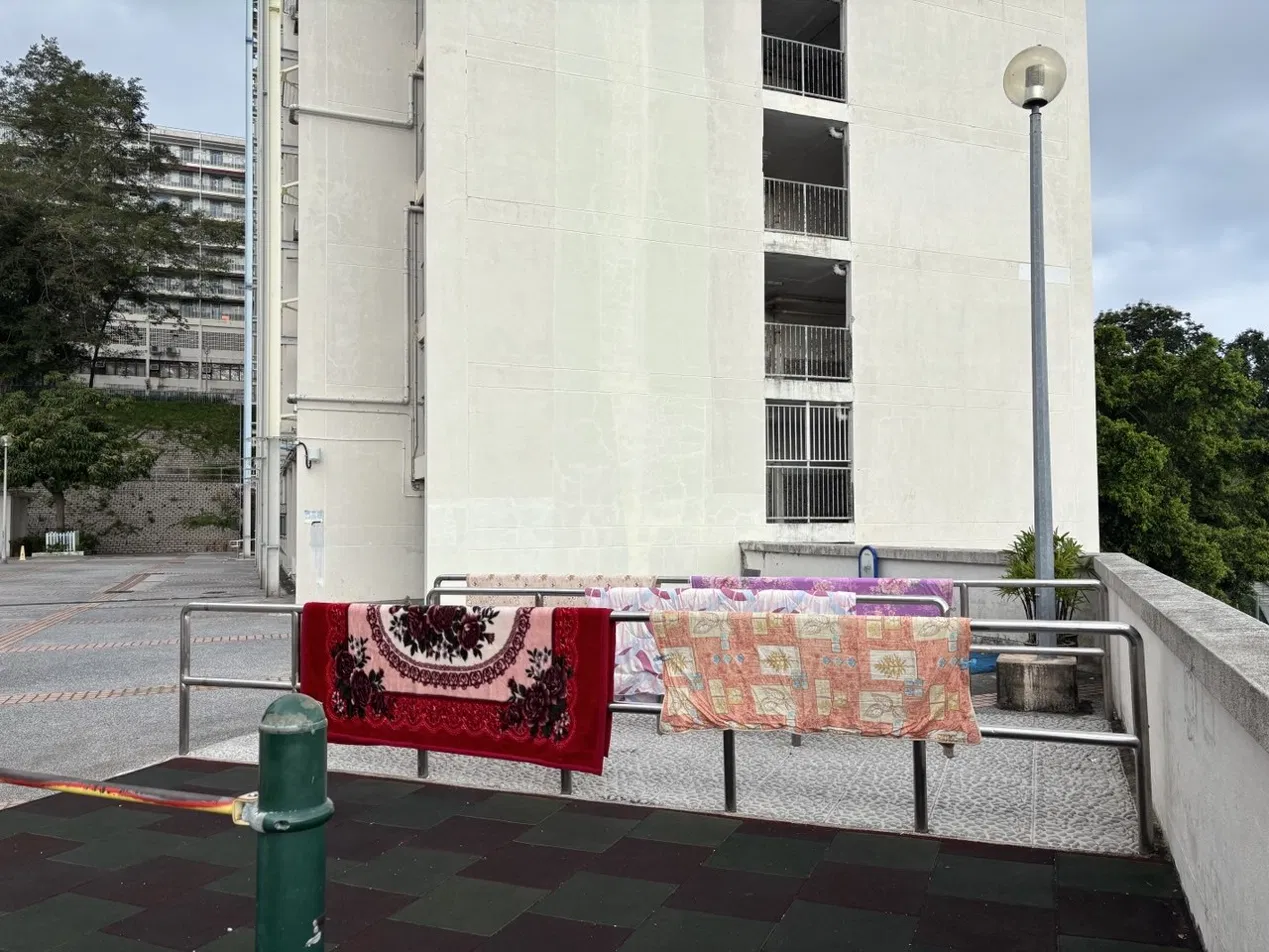
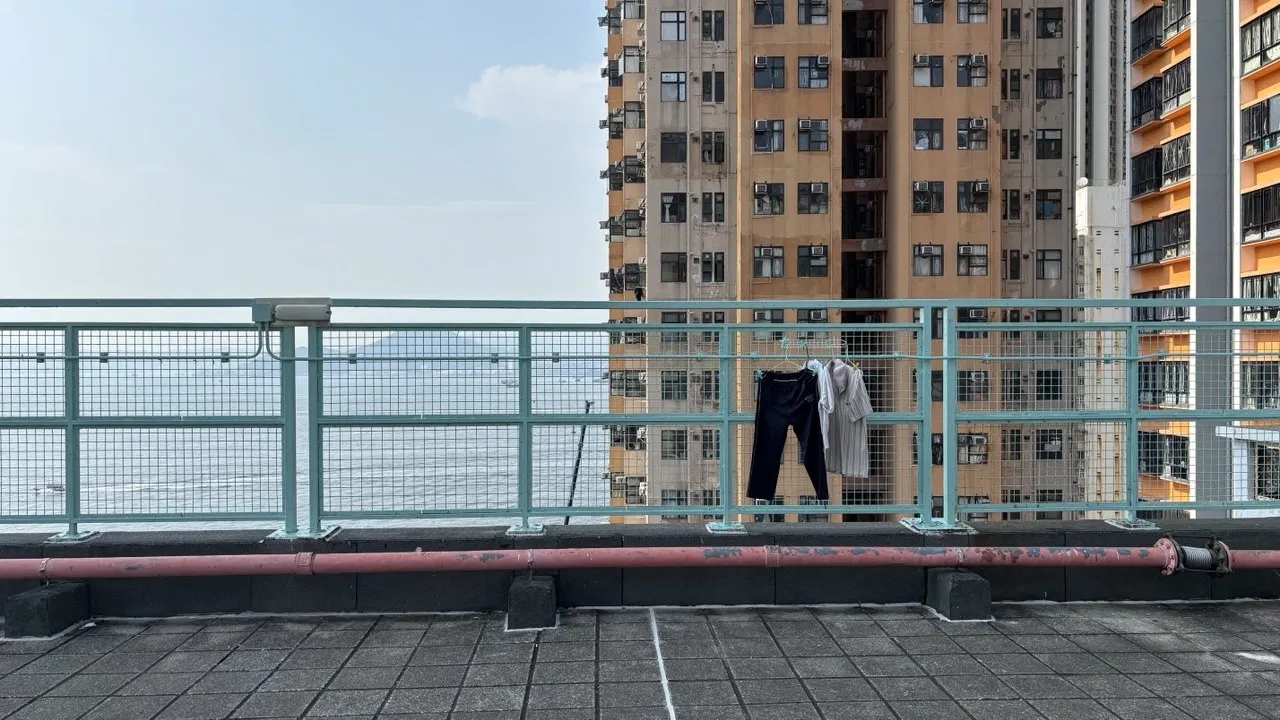
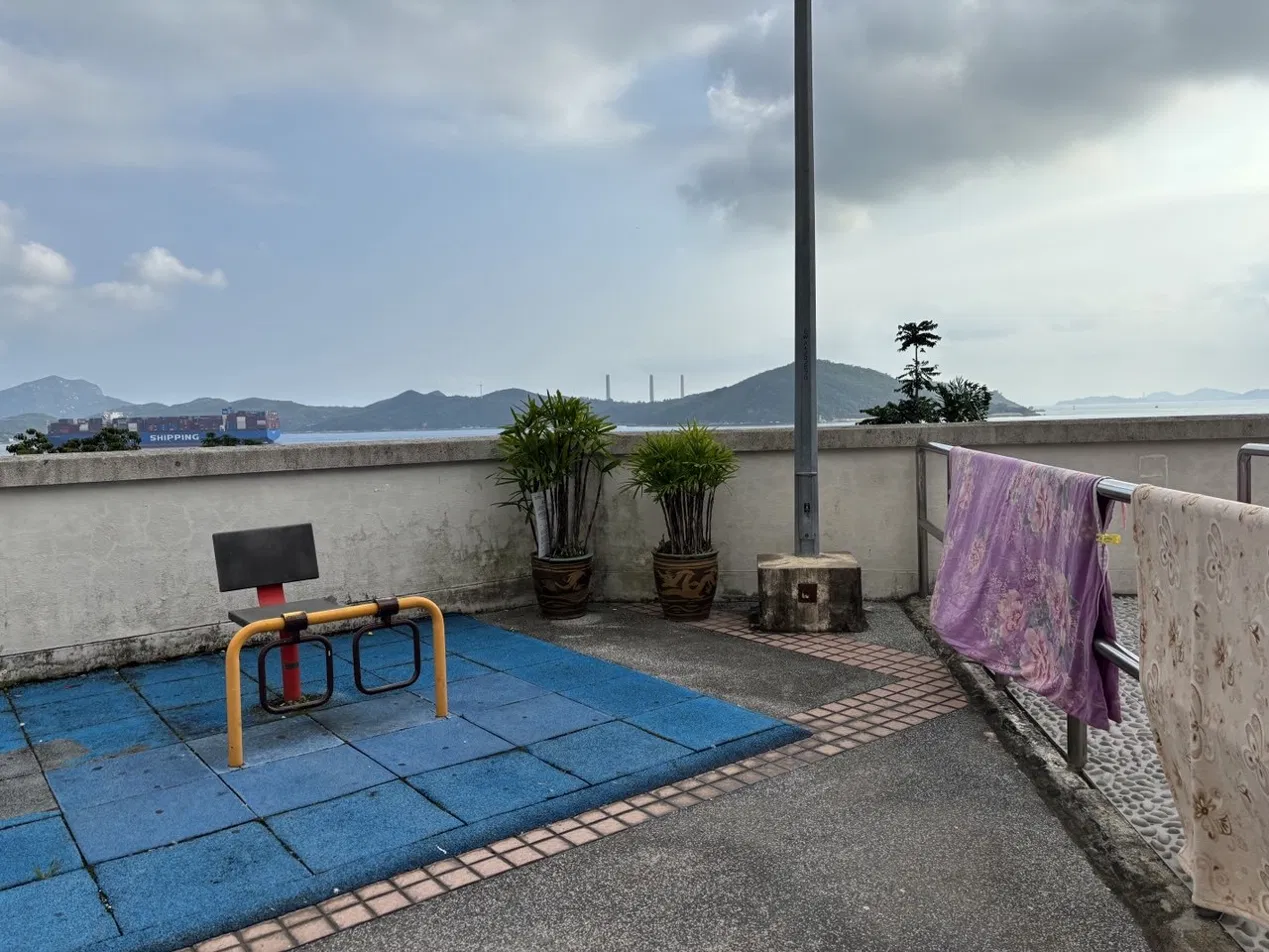
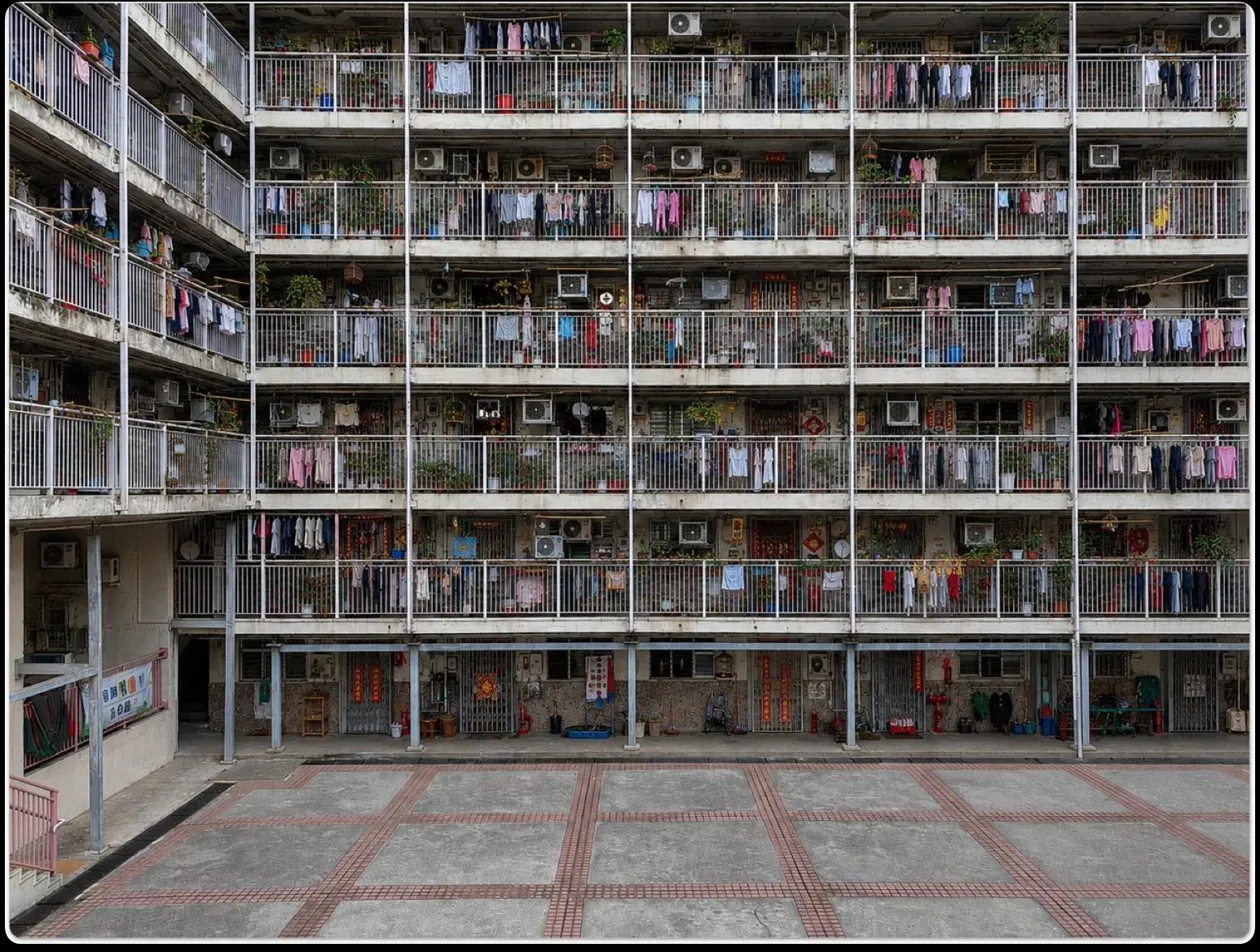
Laundry on poles, plants on ledges, grilles, small personal things. The presence of life, written onto the architecture over decades.
The root question: how do the traces left by other inhabitants shape whether a place feels welcoming — or threatening?
Why this — why now
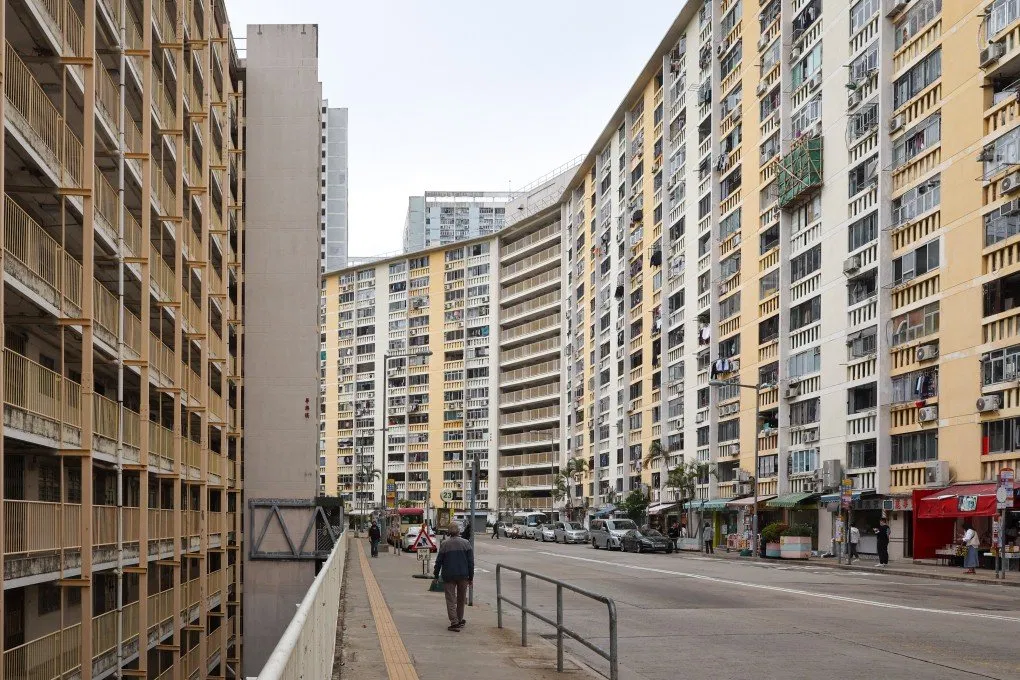
Two eras of public housing, side by side.
Hong Kong is hard to study. The city is visually chaotic — to isolate a perceptual effect, the setting must be near-monolithic. Public housing is ideal: one architectural design, repeated across a whole estate.
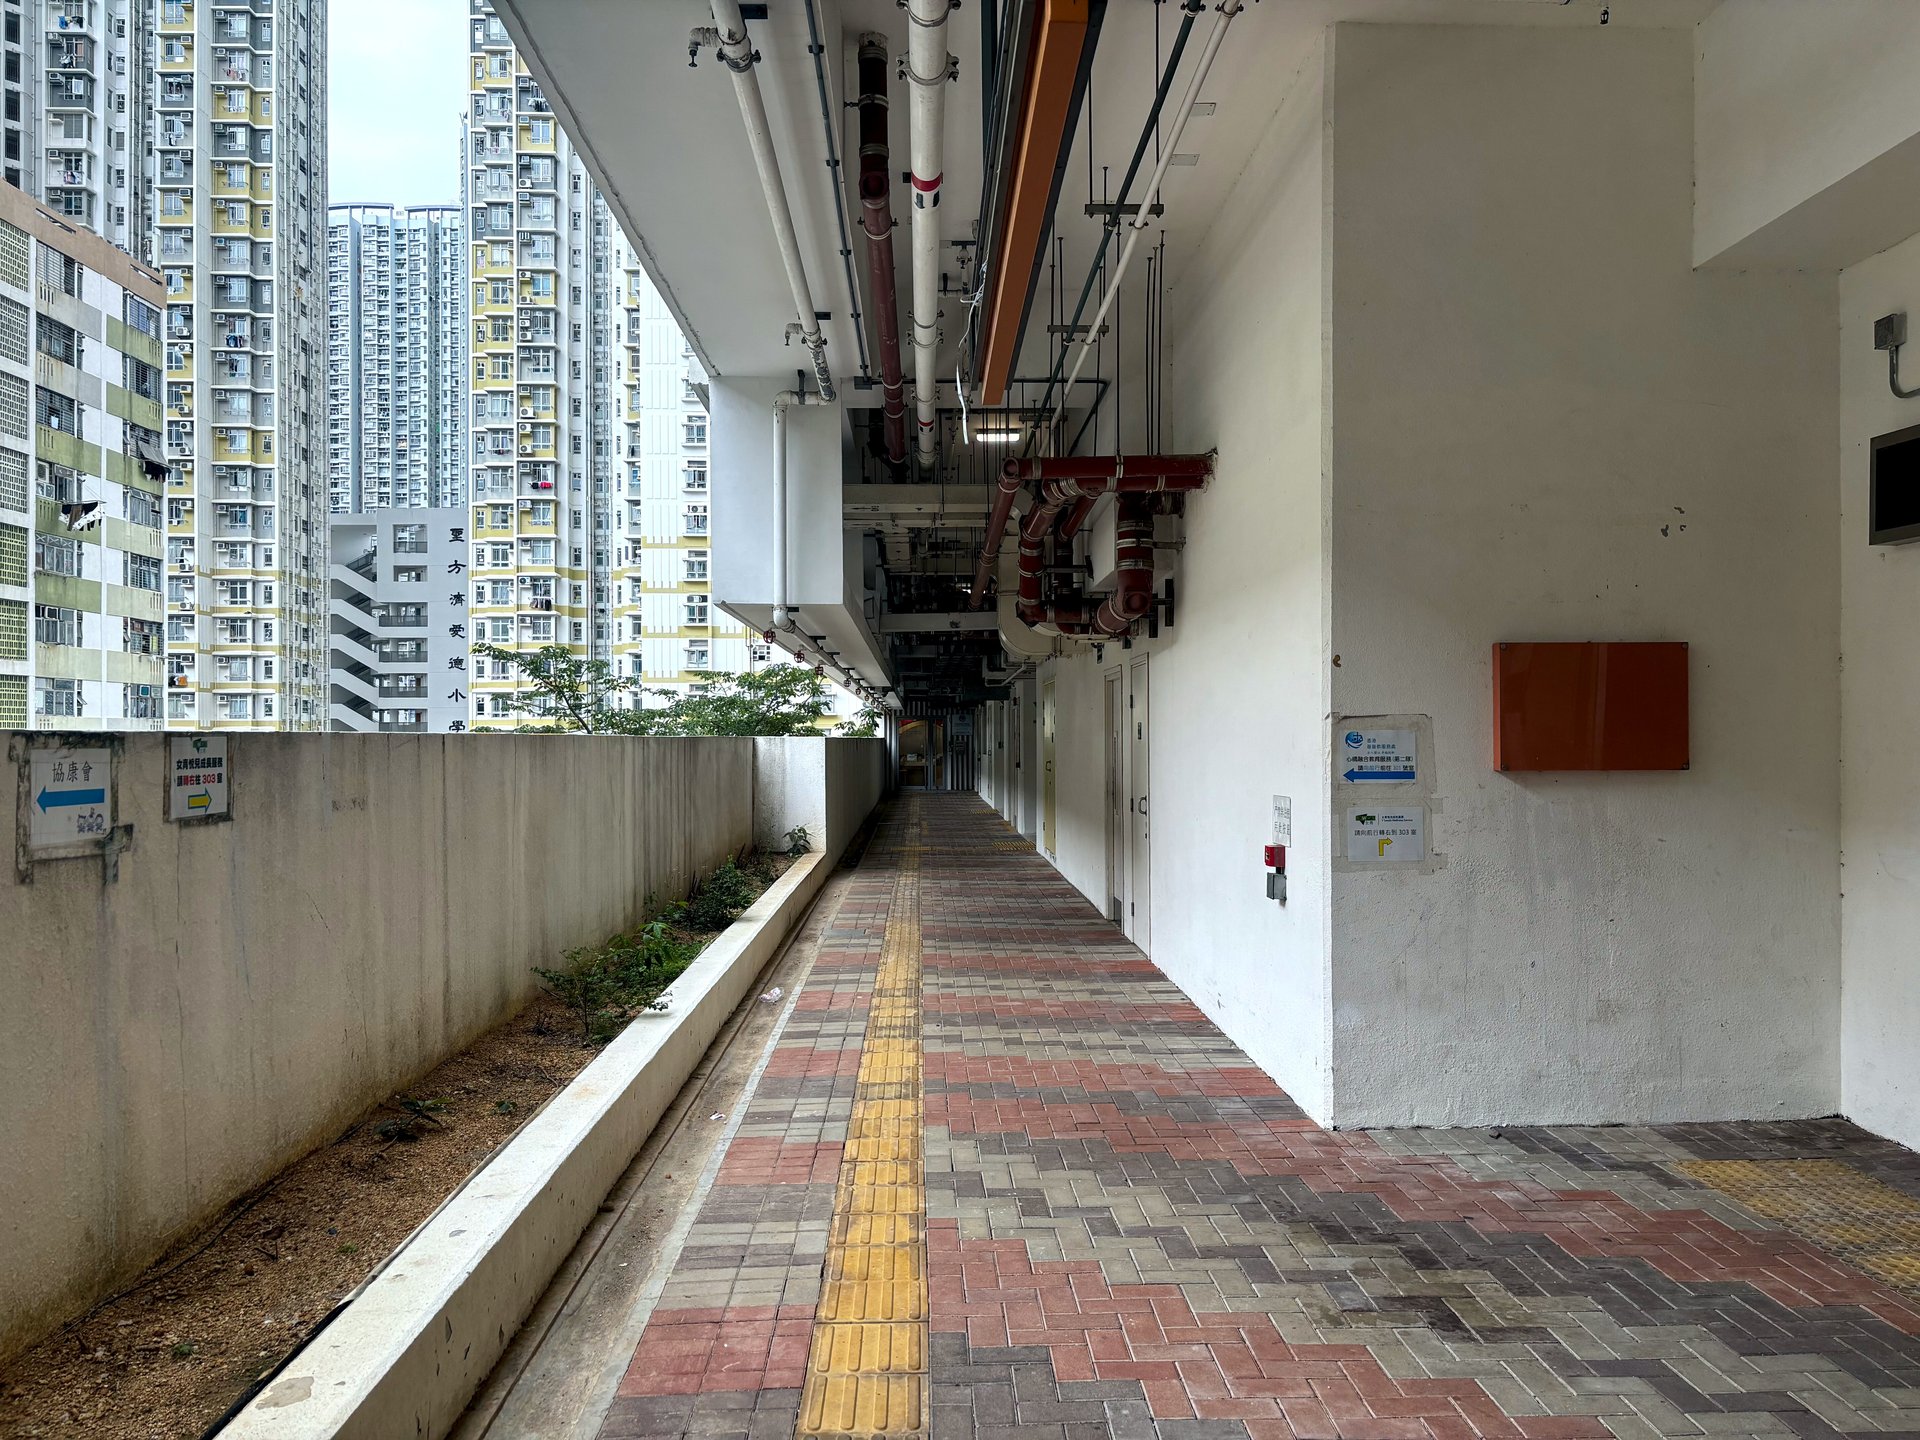
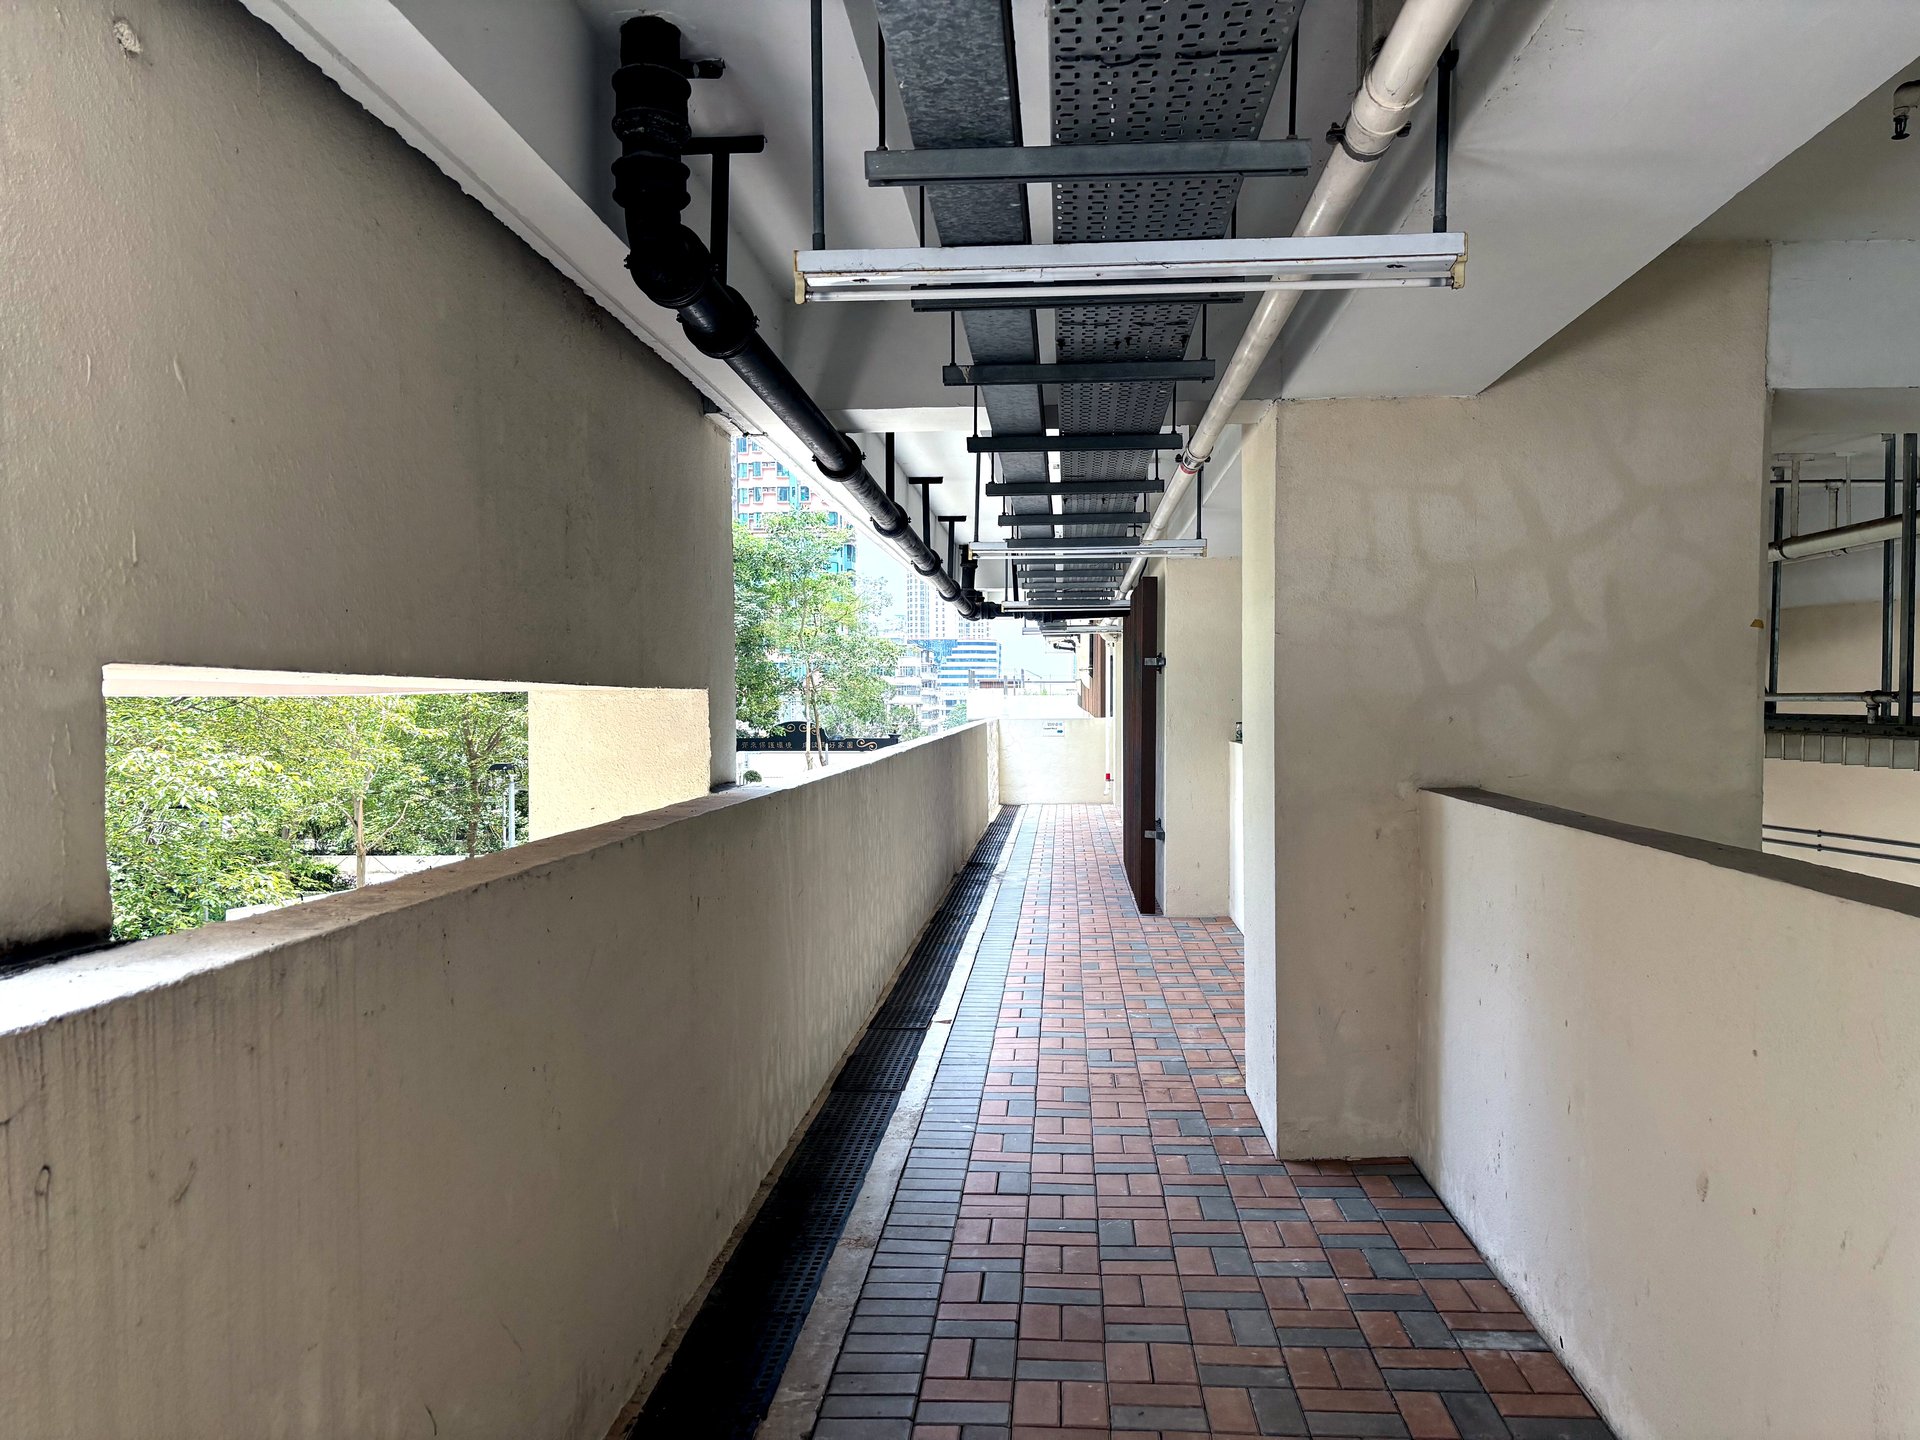
The old estates of the 1950s–60s are being demolished and replaced by new high-rises. An urgent question follows.
Is the new really better — and do the old estates deserve demolition?
Methodology · the full picture
Variables & hypotheses, in one framework.
Independentmanipulated
Core construct
Inhabited Visual Complexity
Visual complexity from resident-added elements — laundry, AC units, plants, grilles — built up through inhabitation. Manipulated by inpainting at low / medium / high density.
Primary contrast uses real photographs · estate entered as a random effect · generative IVC variants validated as a separate, labelled condition.
Theoretical framework
Three established theories, one new idea.
Restoration
Calm, softly fascinating places let attention recover. (ART, 1989)
Stress recovery
Low-threat environments calm the body. (SRT, 1983)
The sweet spot
We like moderate complexity — not too empty, not too much. (1960)
The new idea — Inhabited Visual Complexity (IVC):the visual richness that builds up through decades of living — laundry, plants, grilles, signage. Never measured in neuroscience before.
Inhabited Visual Complexity — in the real world
This is what we mean by traces of life.
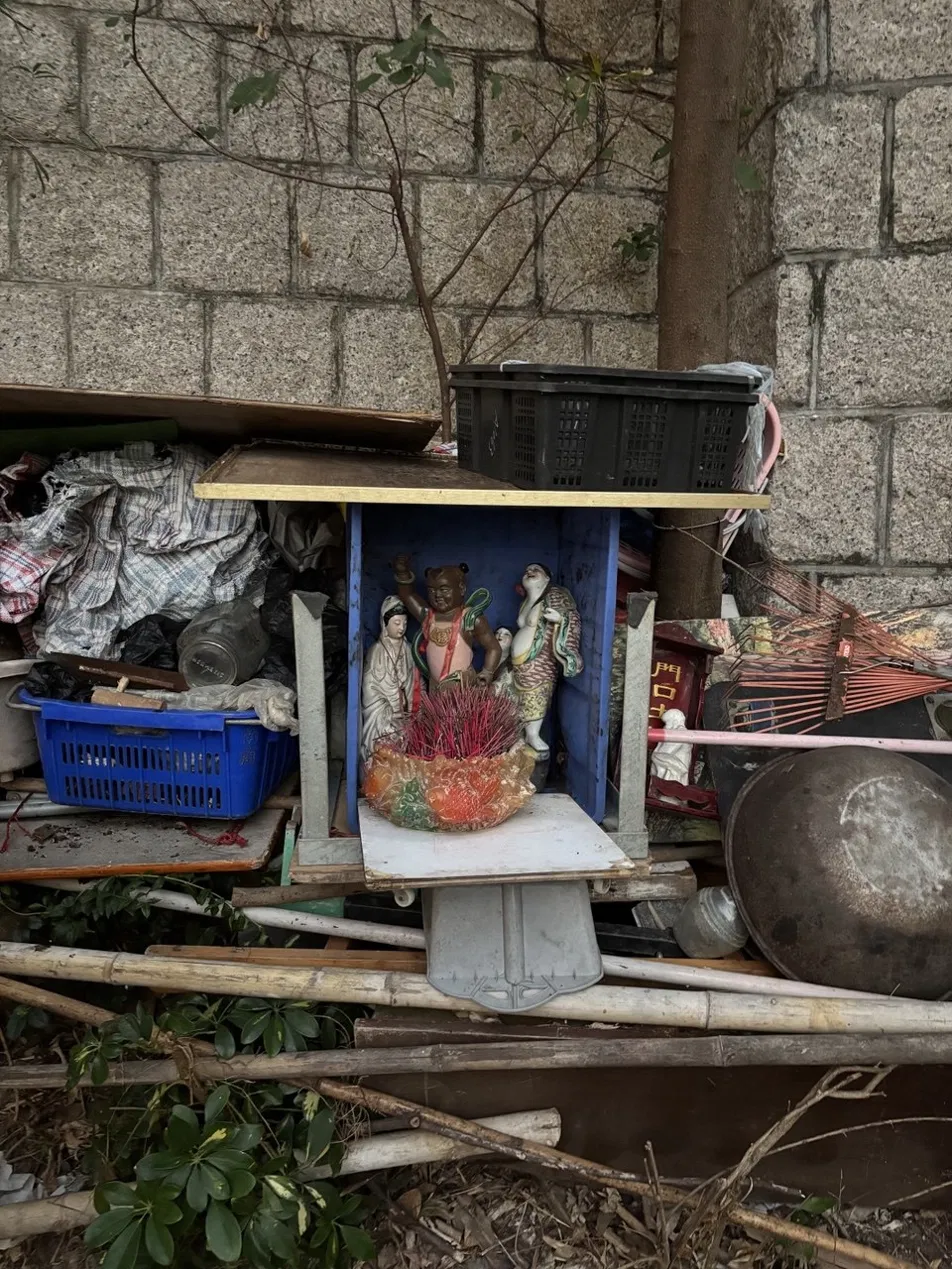
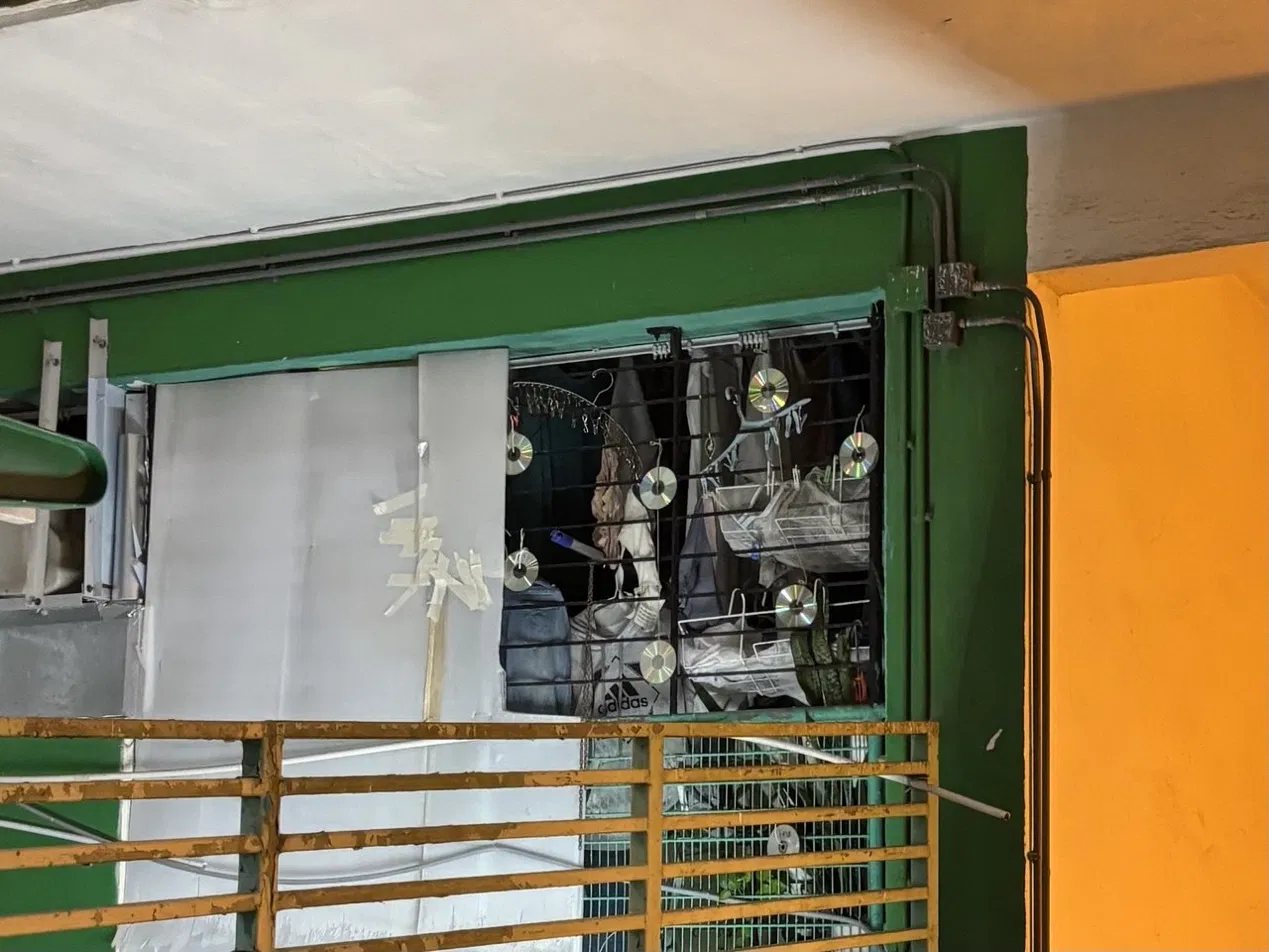
Laundry & bedding on railingsPotted plants on a rooftopA makeshift shrine & stored thingsA window packed with daily life
None of this is designed. It accumulates as people live — and it may be exactly what makes older estates feel alive.
The core idea, in one curve
Why old estates may feel better.
New towers are clean but monotonous — sitting low on the left. The accumulated life of older estates may push them toward the peak, where environments feel most restorative.
What the data should show
Four predictions.
Approach, not withdrawal
Old estates → brain signature of moving toward, not away (frontal alpha asymmetry).
Calmer
Old estates → higher alpha waves → a more relaxed, restorative state.
More tense
New towers → higher beta waves → more cognitive arousal / stress.
Driven by IVC
More traces of life → more positive response, following the inverted-U.
From theory to a study
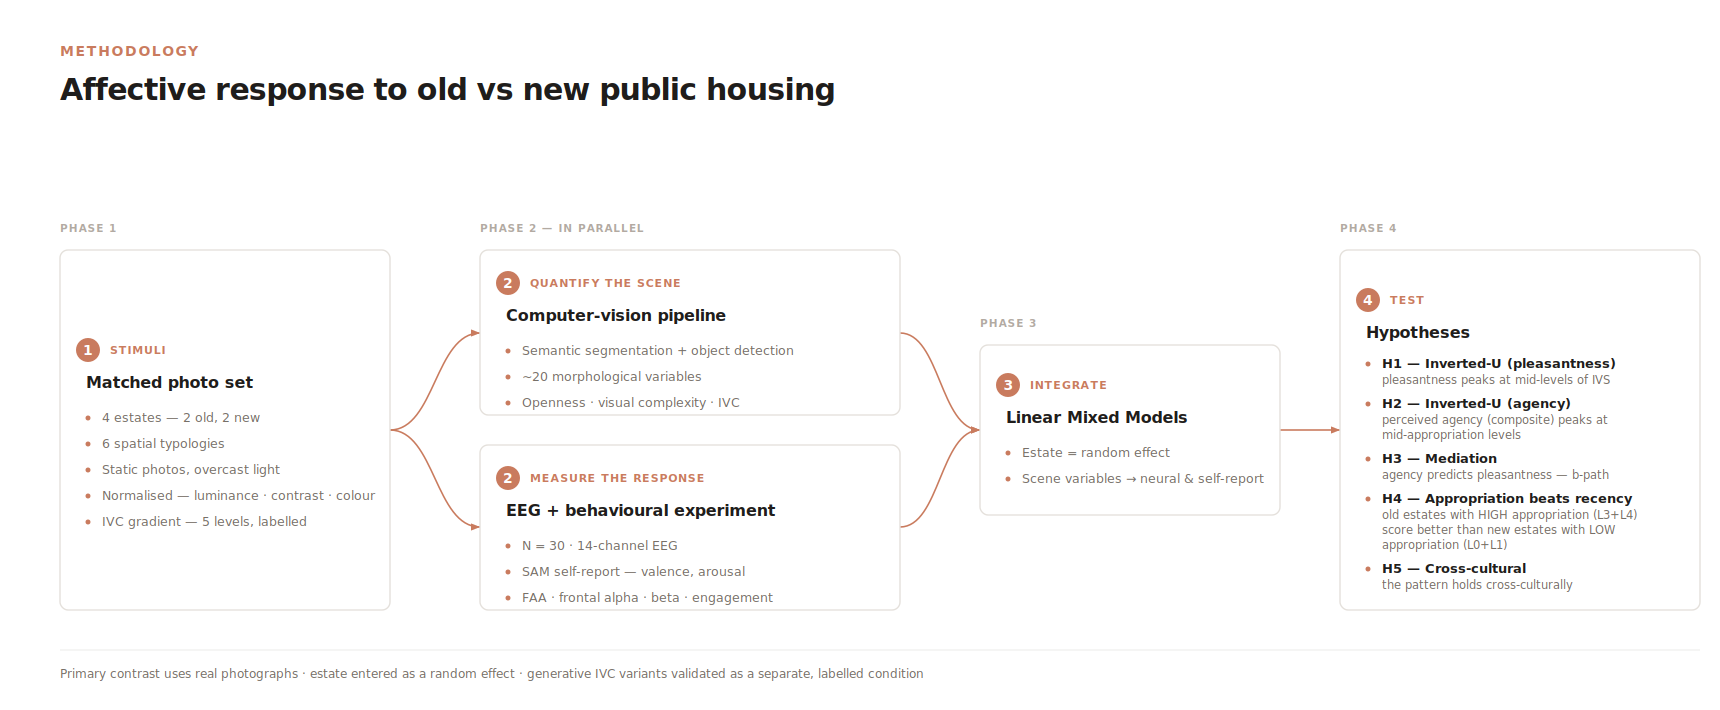
The research design, end to end.
Four phases — matched stimuli · parallel scene-quantification & EEG measurement · linear mixed models · five hypotheses tested.
Method · Step 00 — a path not taken
We started with view maps — then let them go.
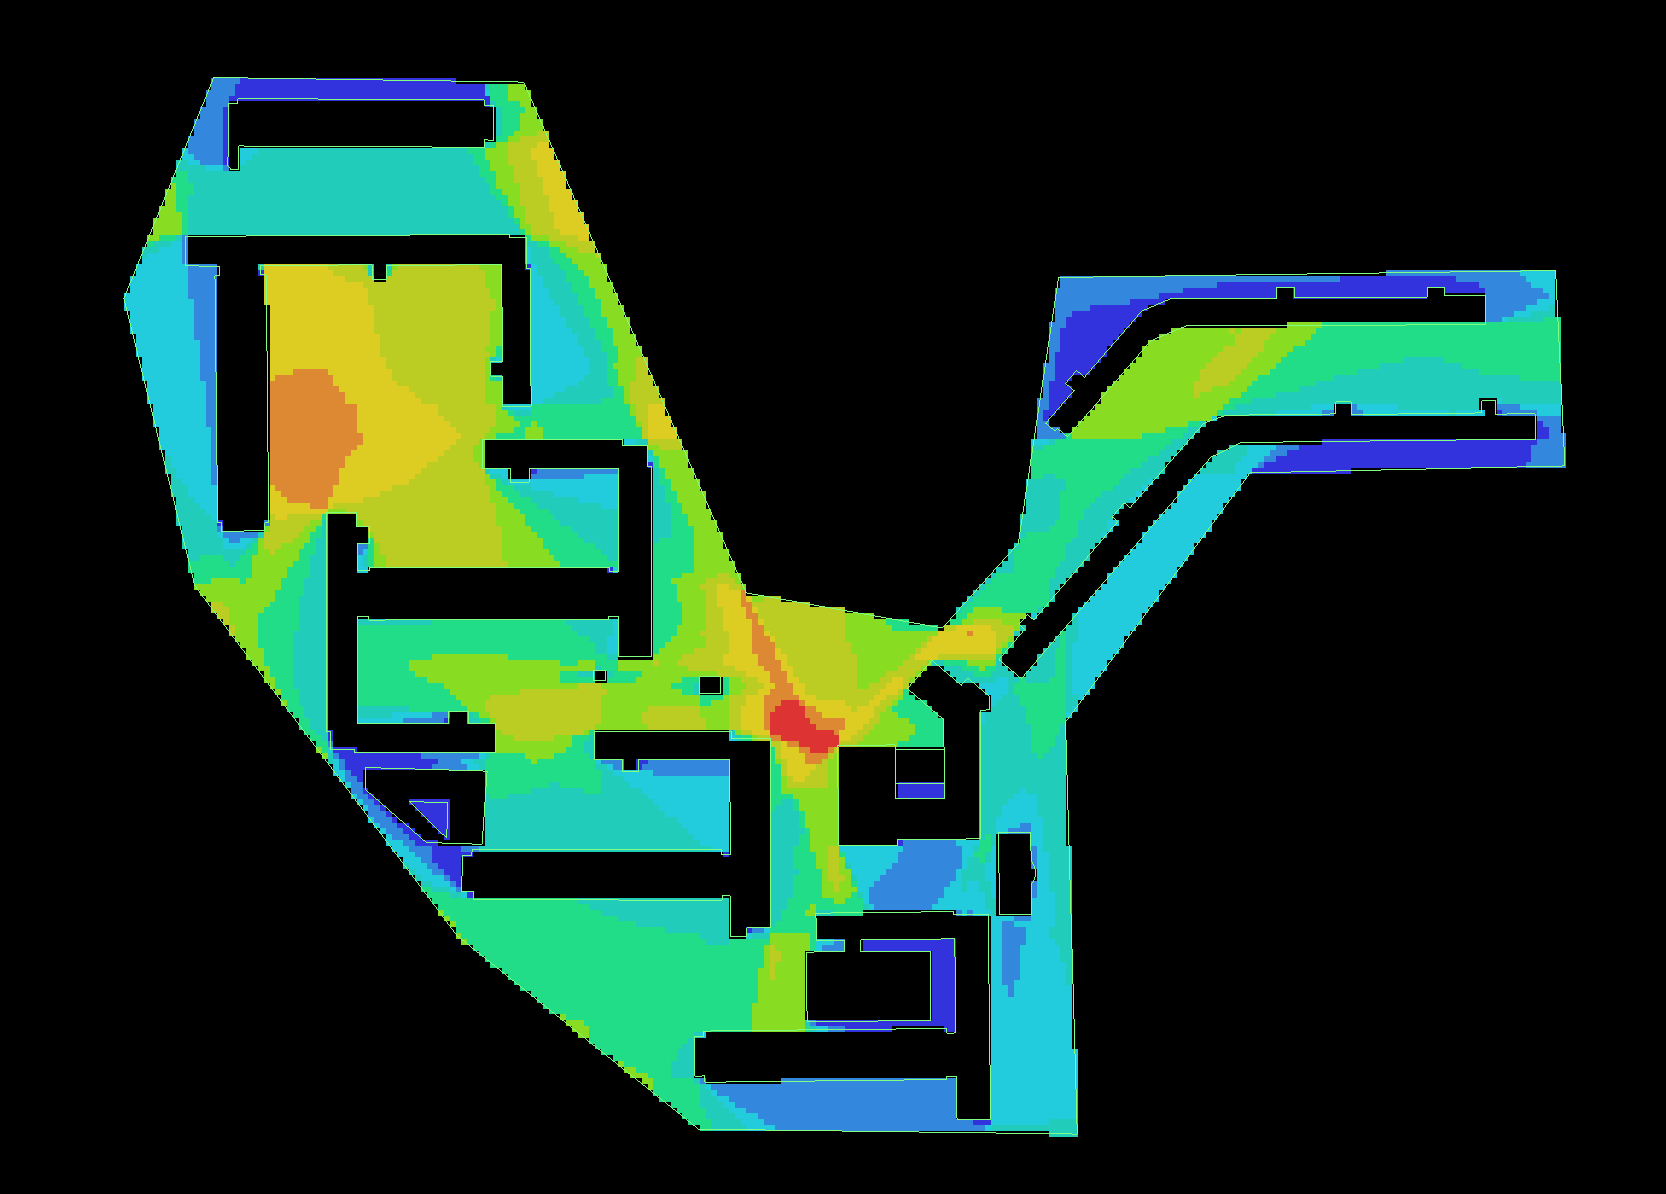
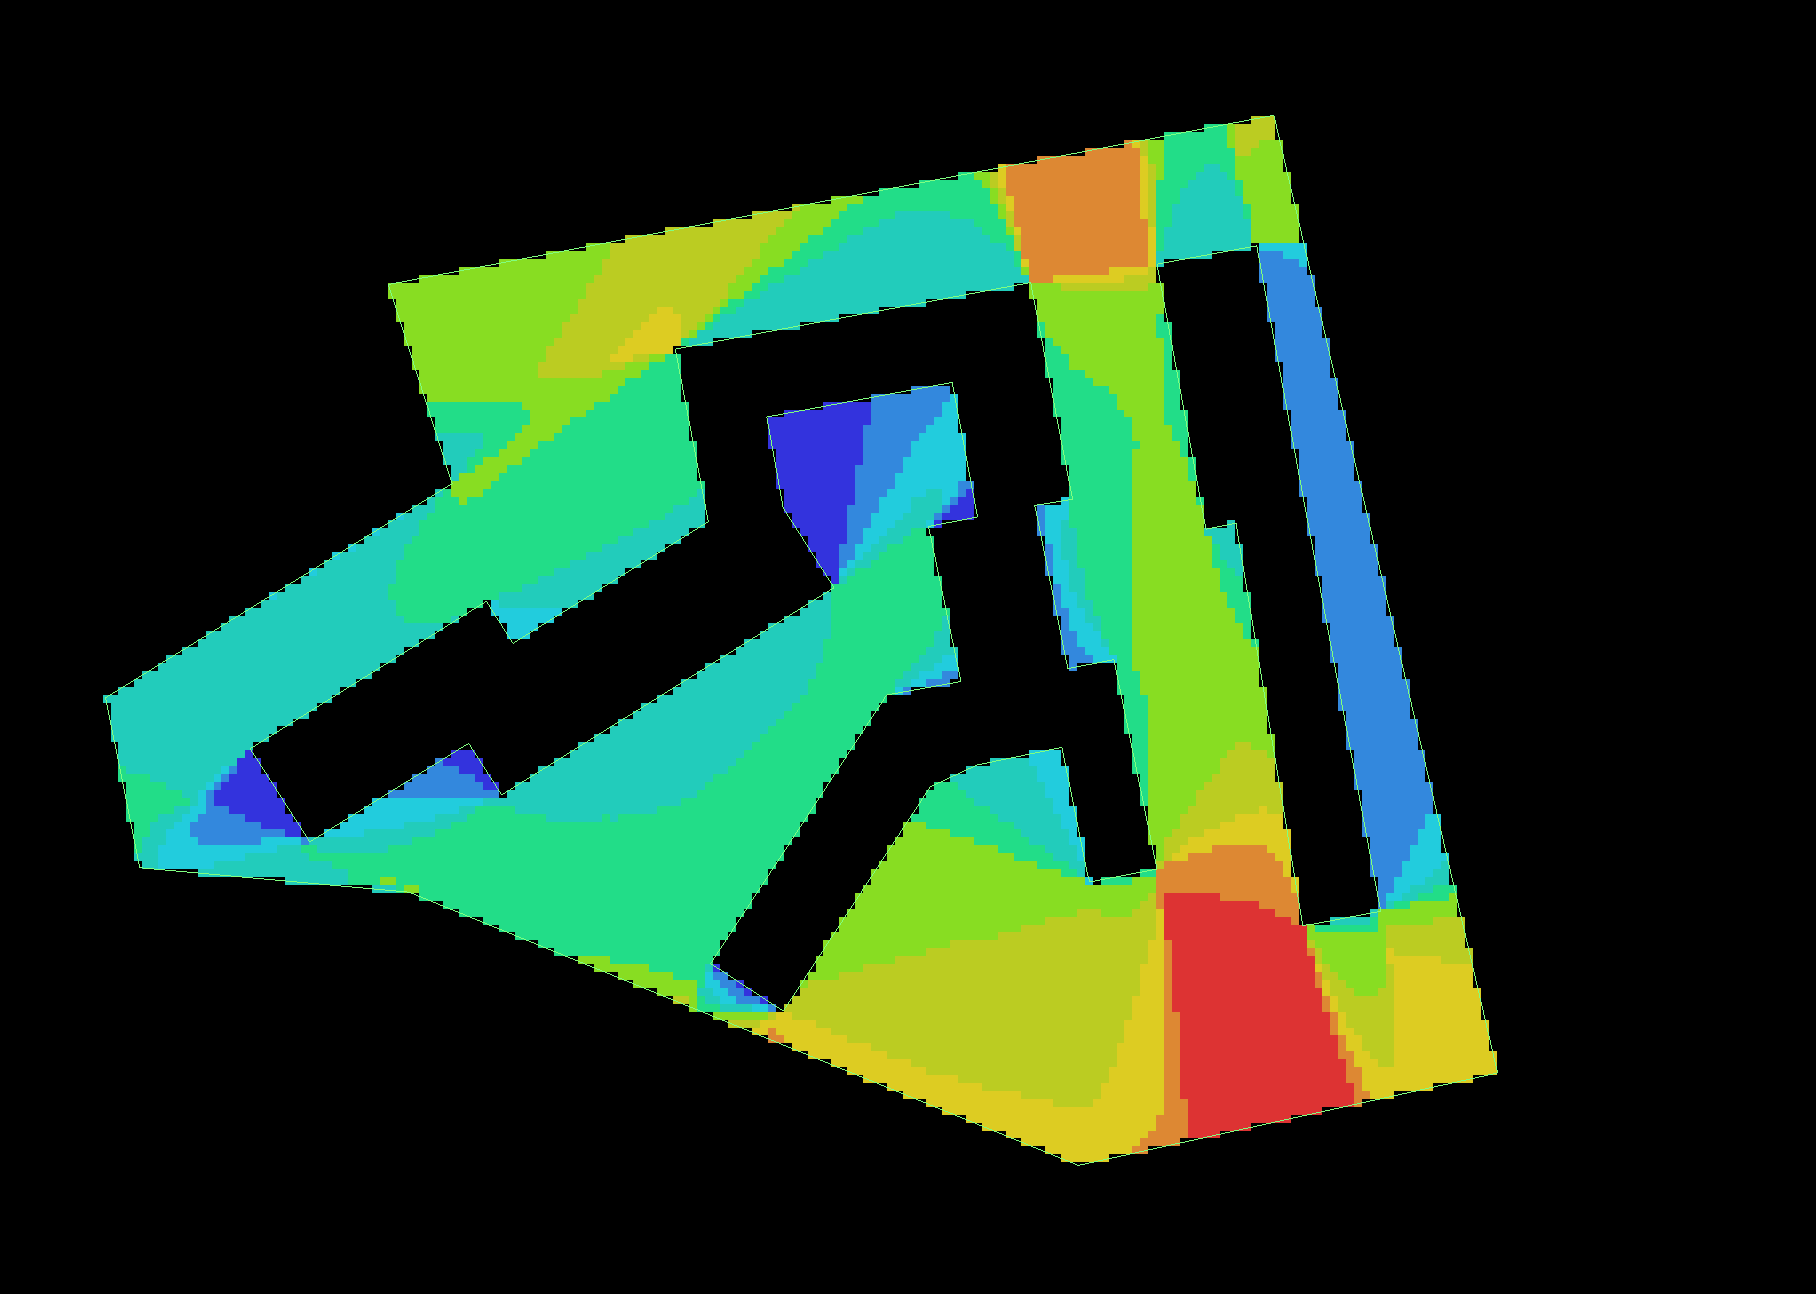
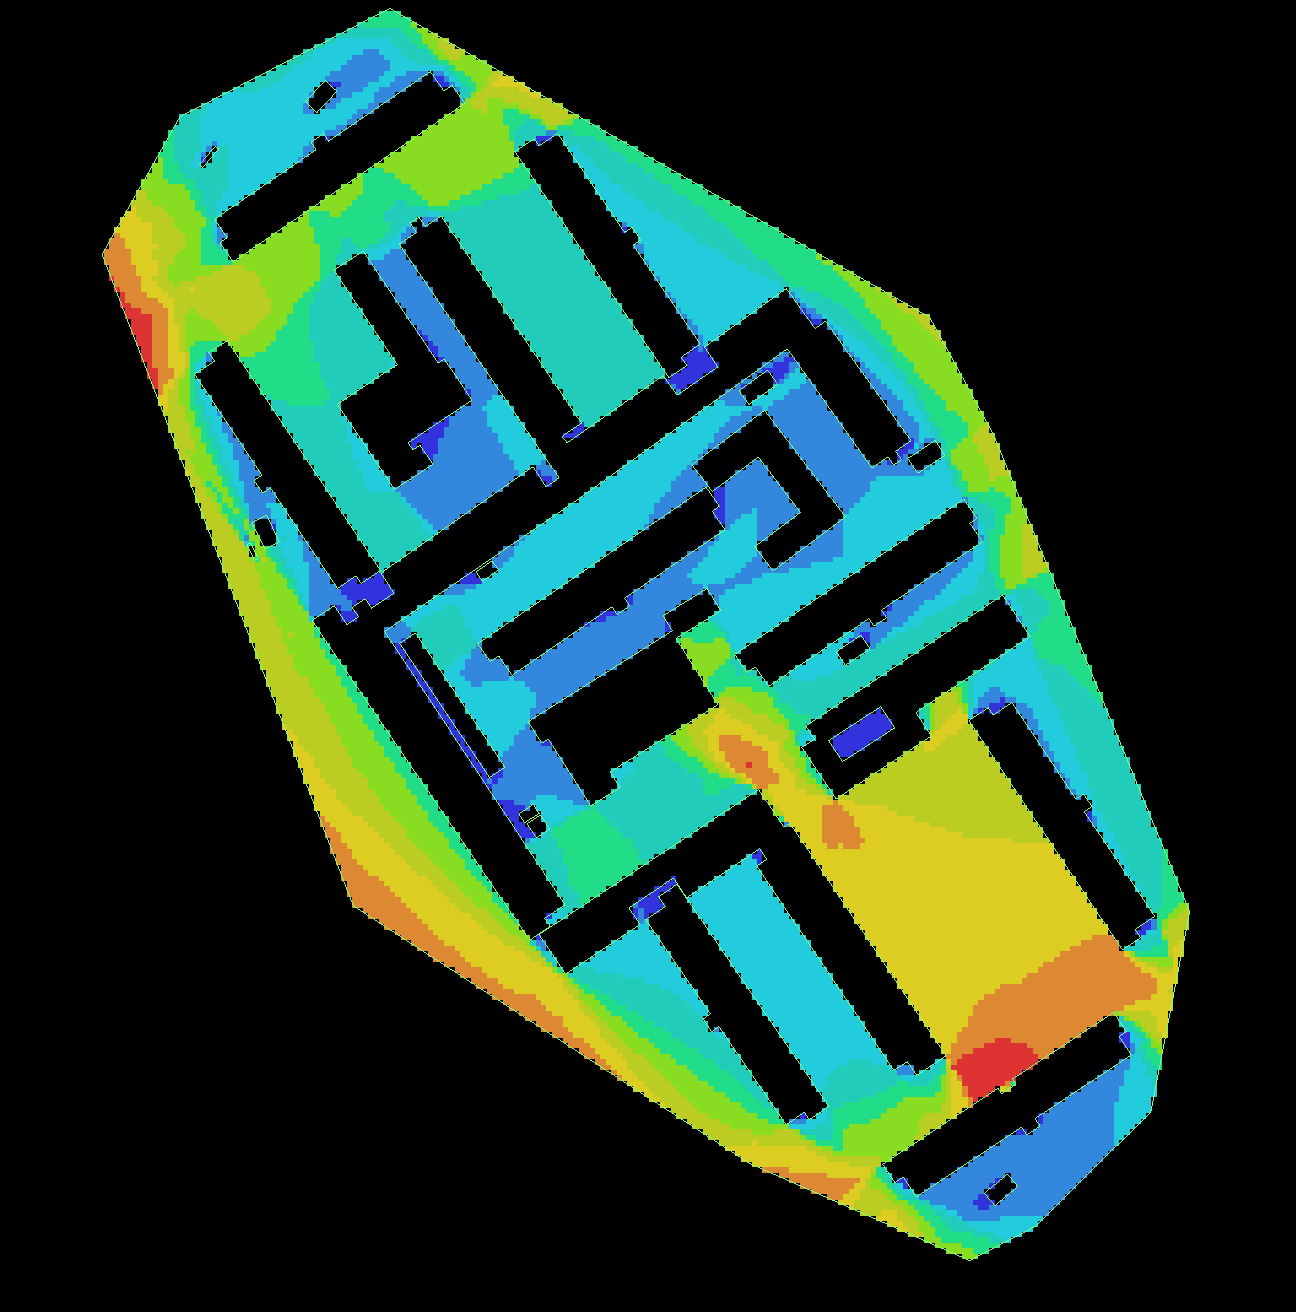
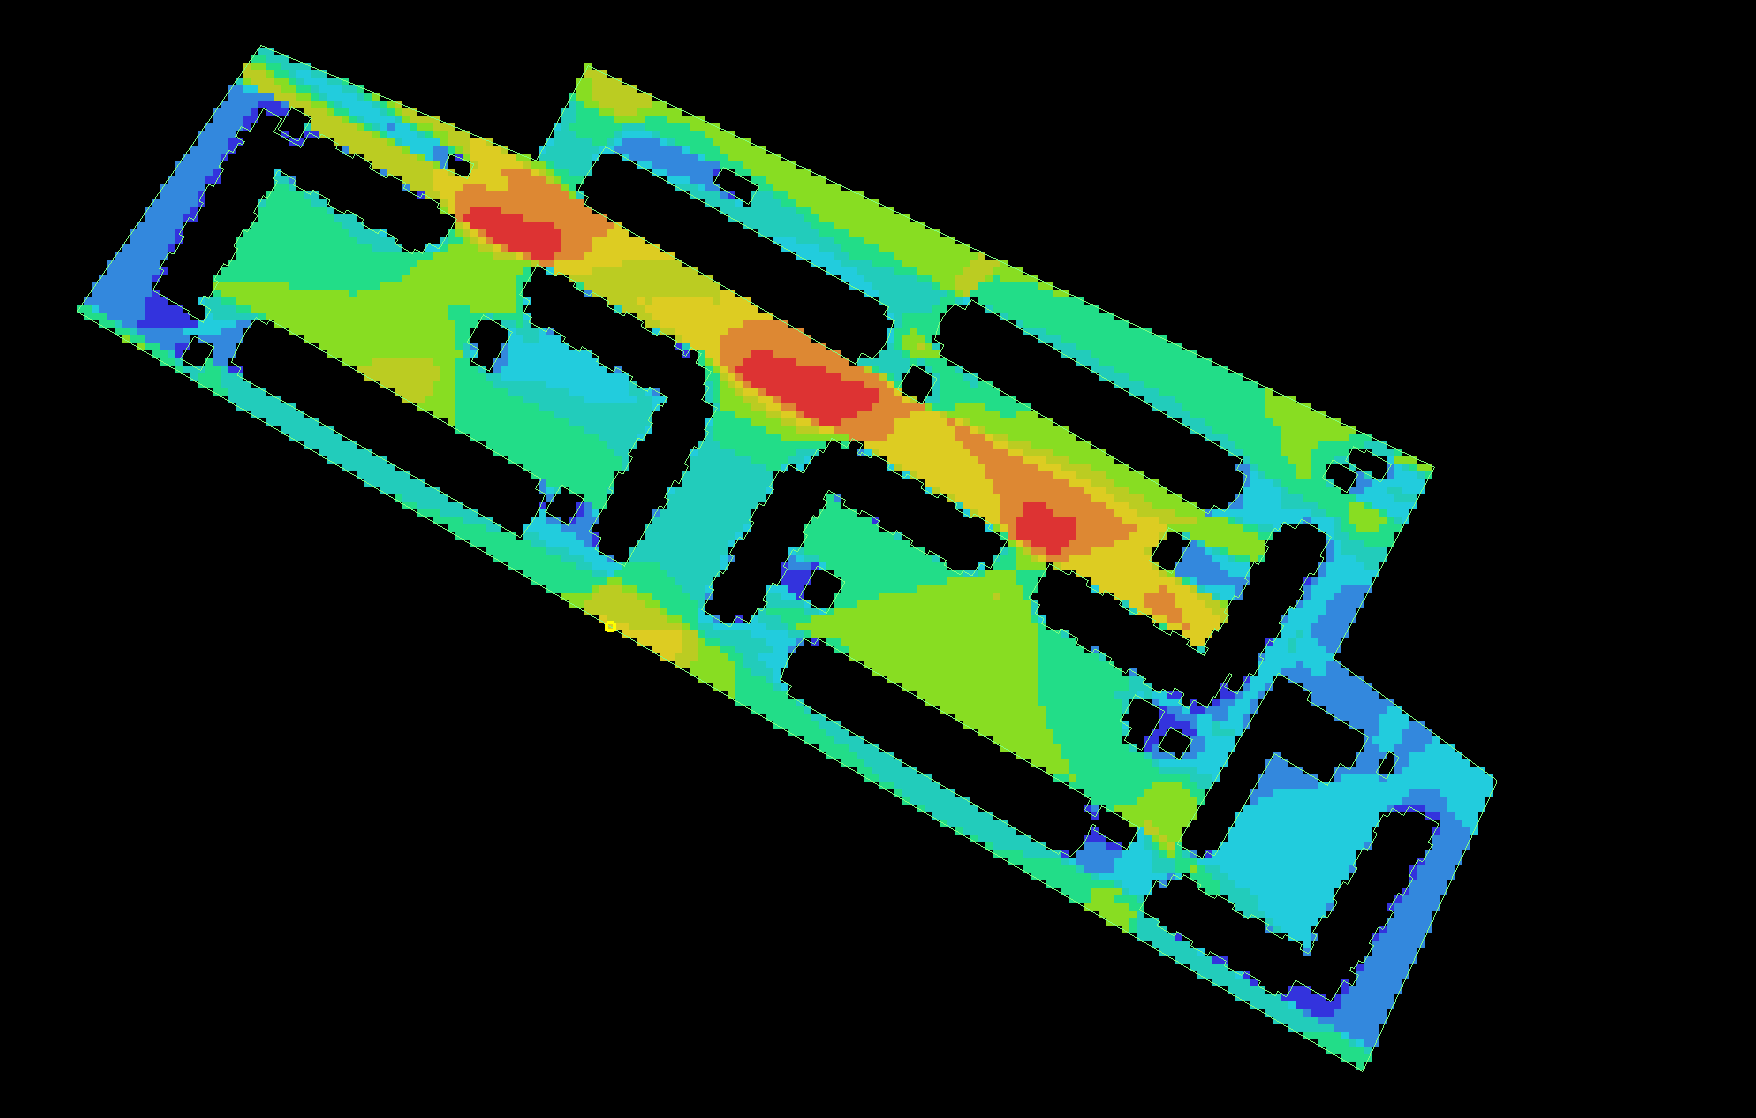
Before the photographic survey, the first step was a visibility (isovist) analysis of each estate — mapping how much of the surroundings is seen from every point in the shared space.
Wah FuSai WanChoi HungFuk Loi
Why we abandoned it: Hong Kong's estates sit on steep, terraced topography. The maps assume a flat datum, so vertical level changes — ramps, podia, retaining walls — broke the visibility model and made the values impossible to compare across sites. The study moved instead to a controlled photographic survey.
The study design
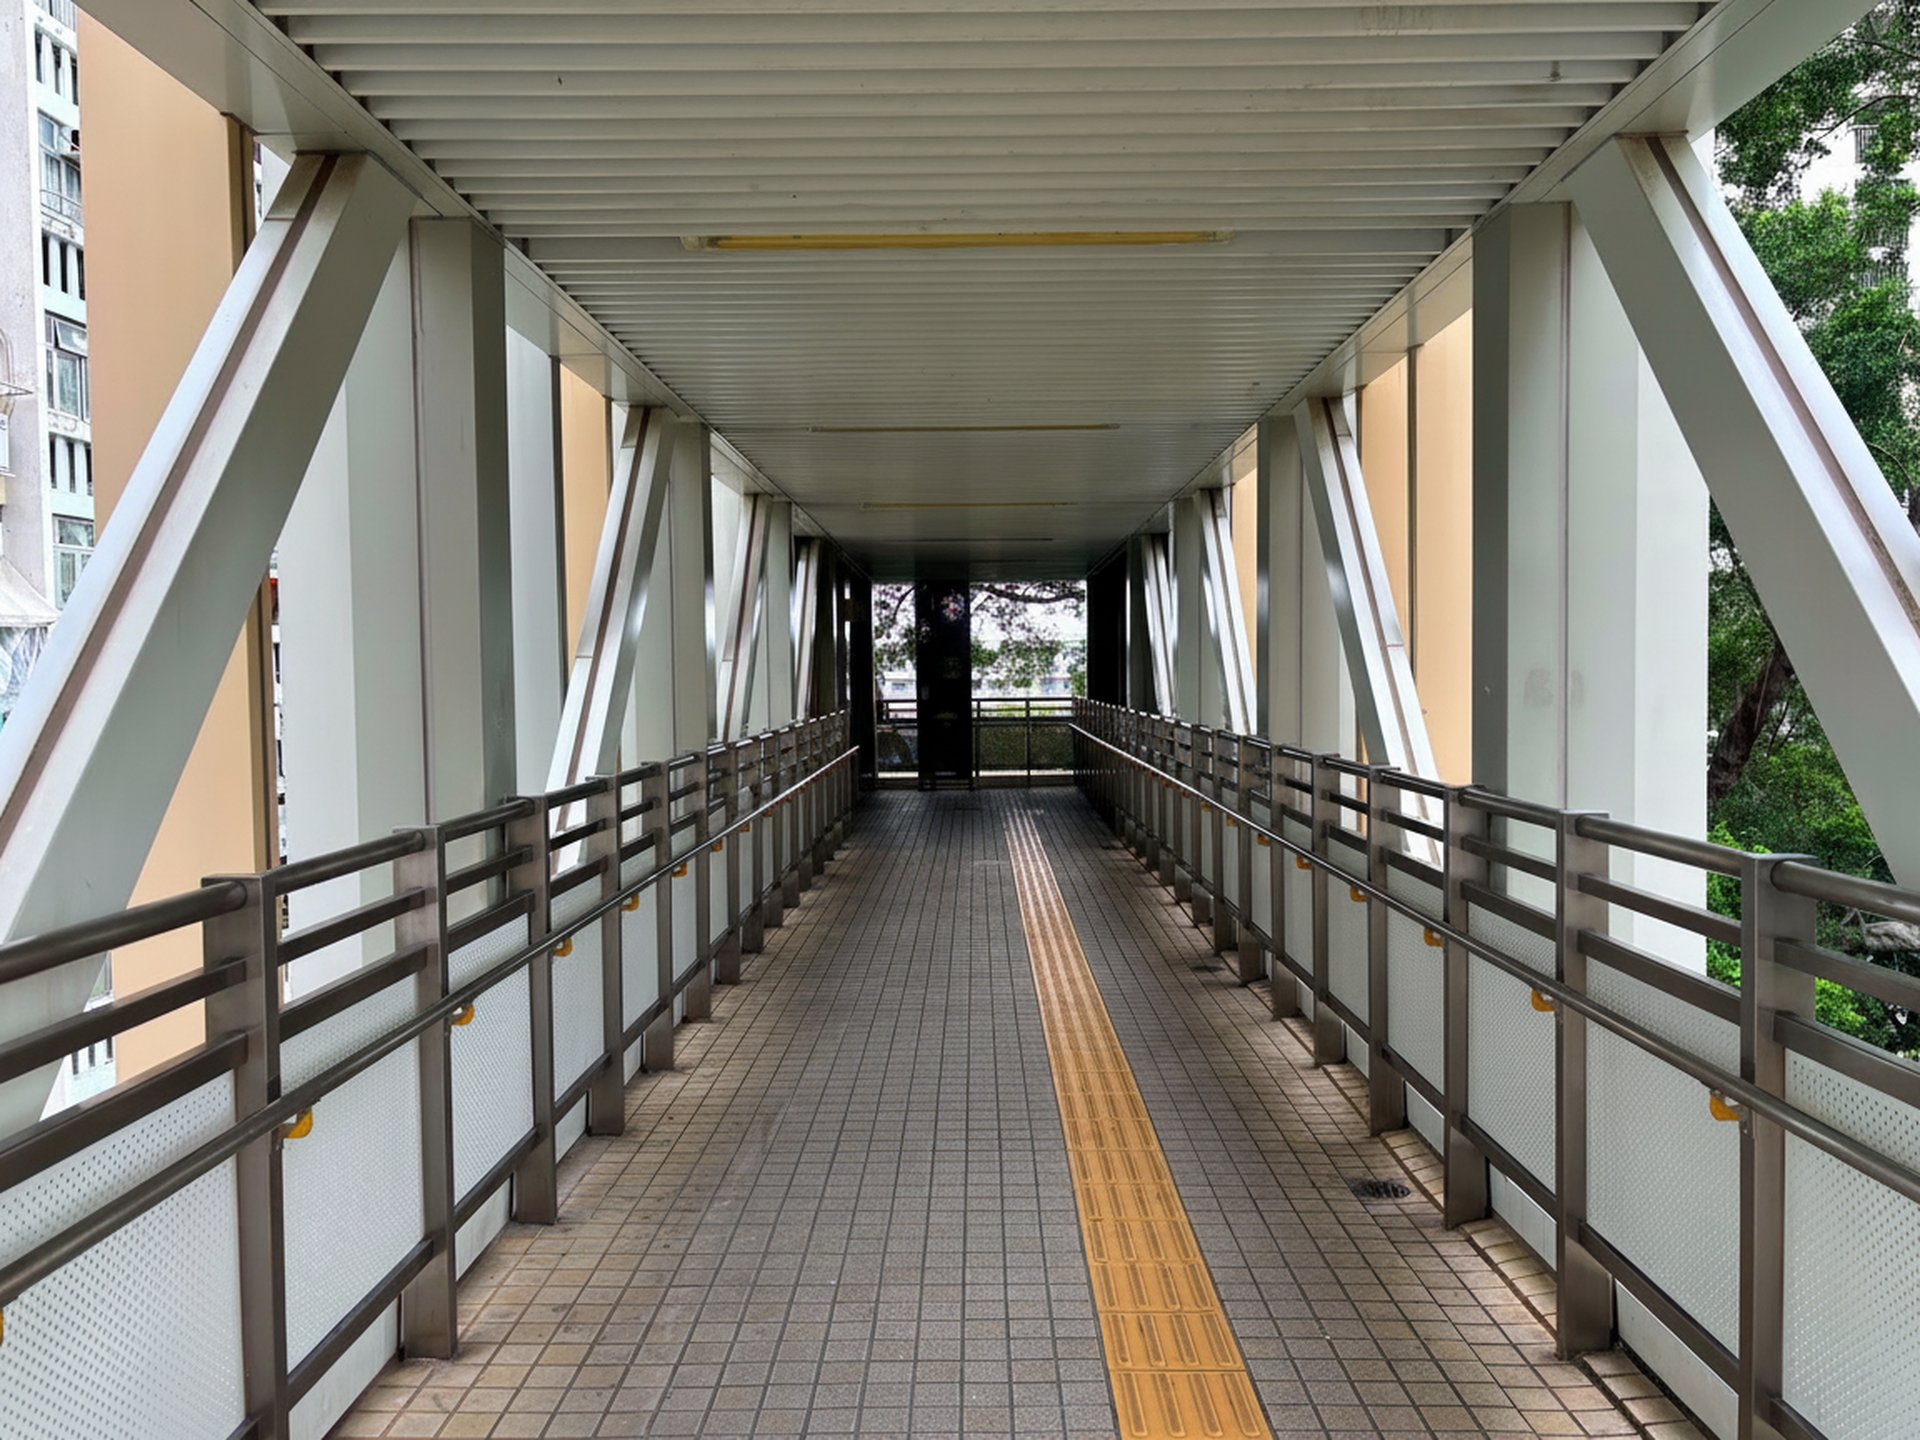
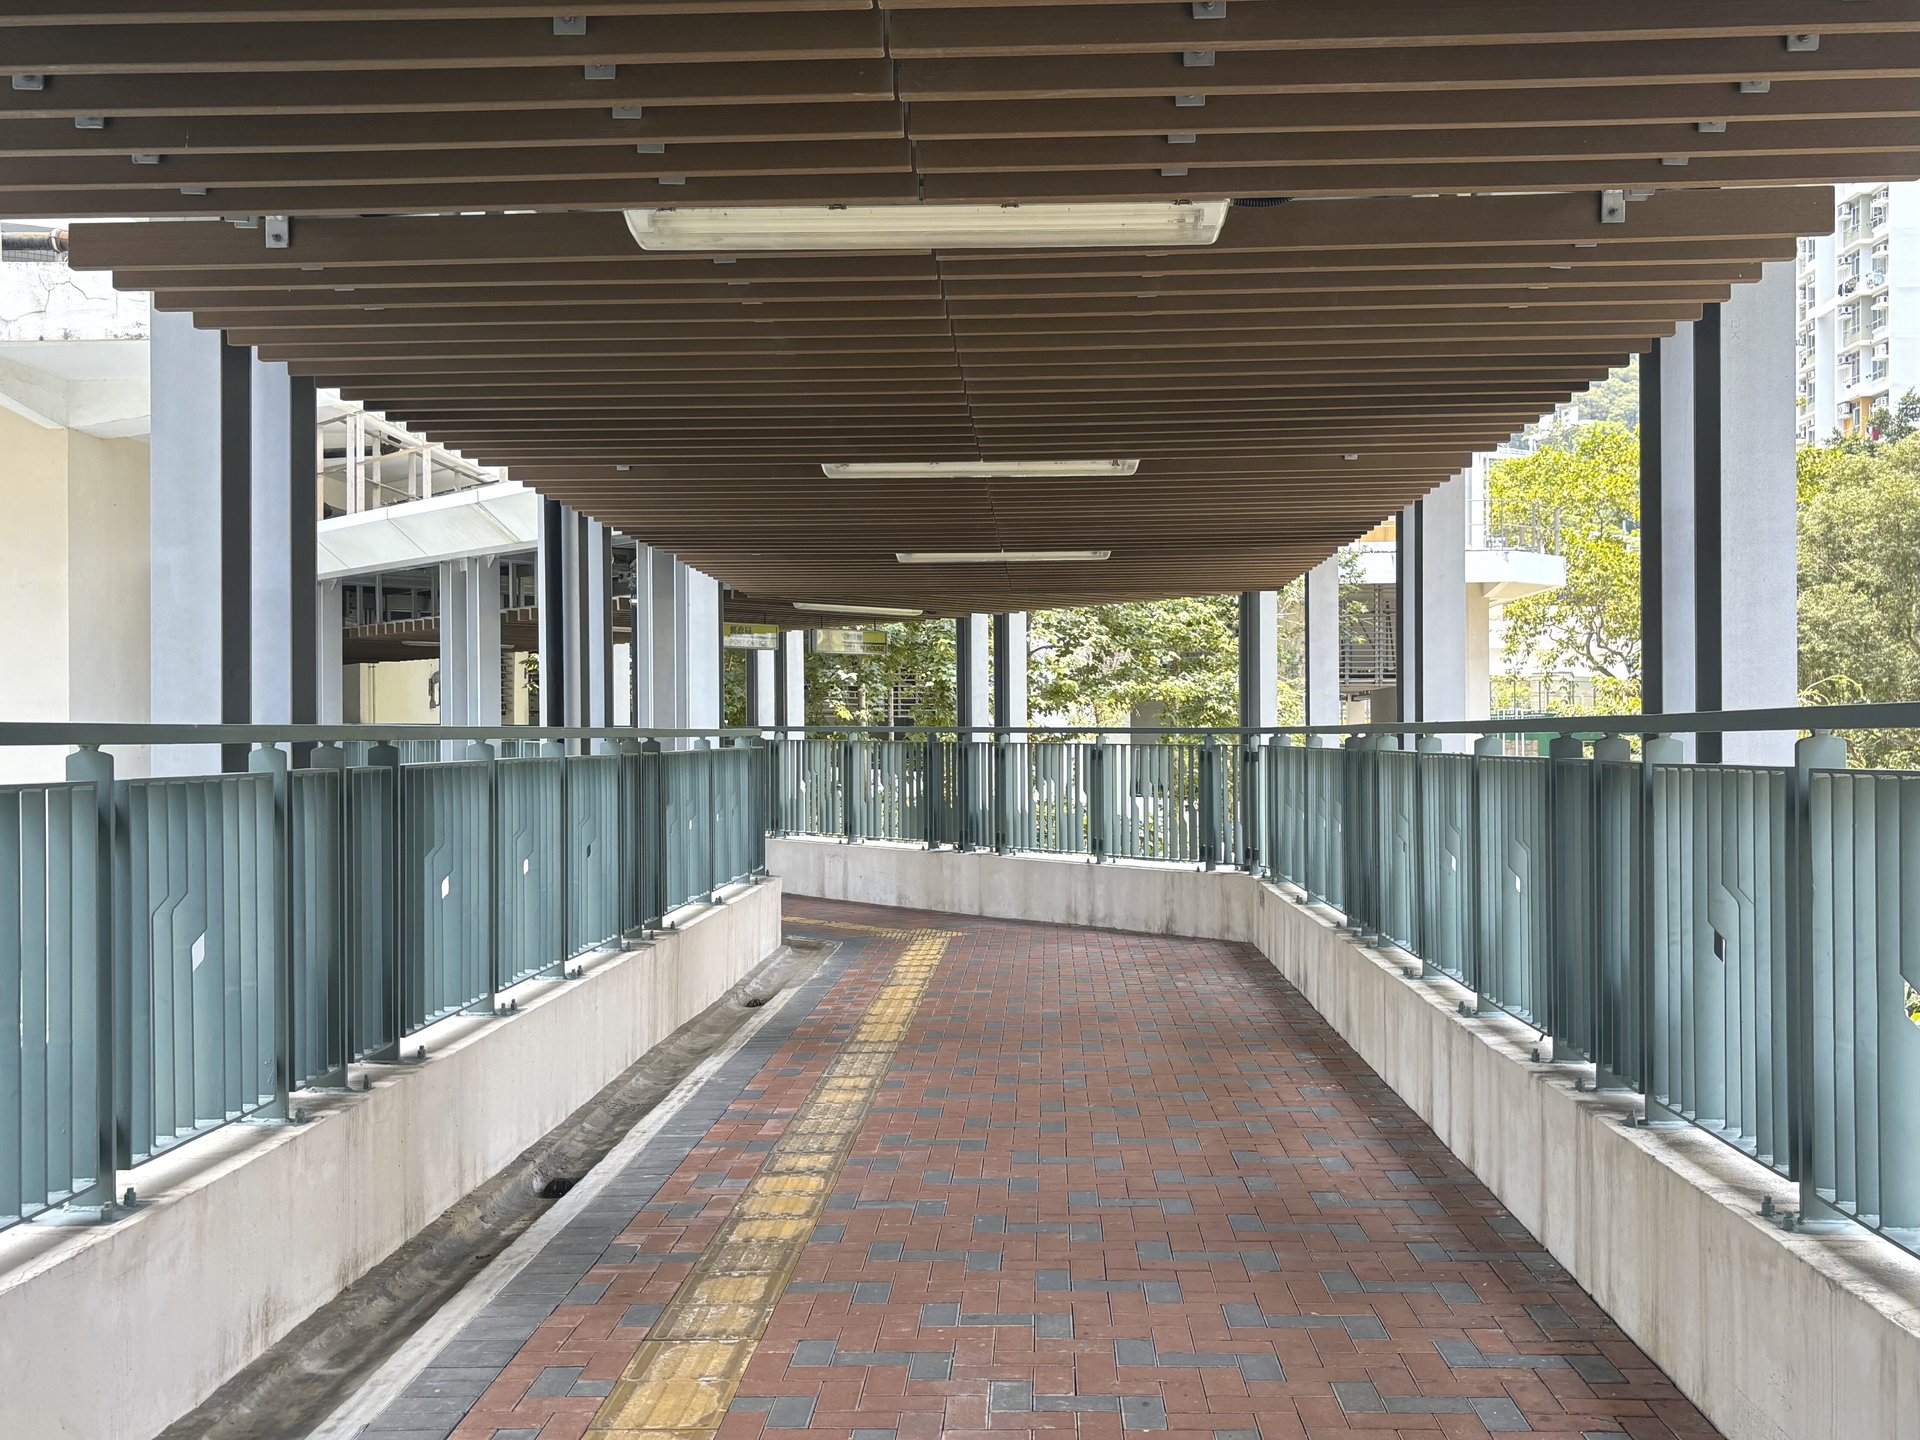
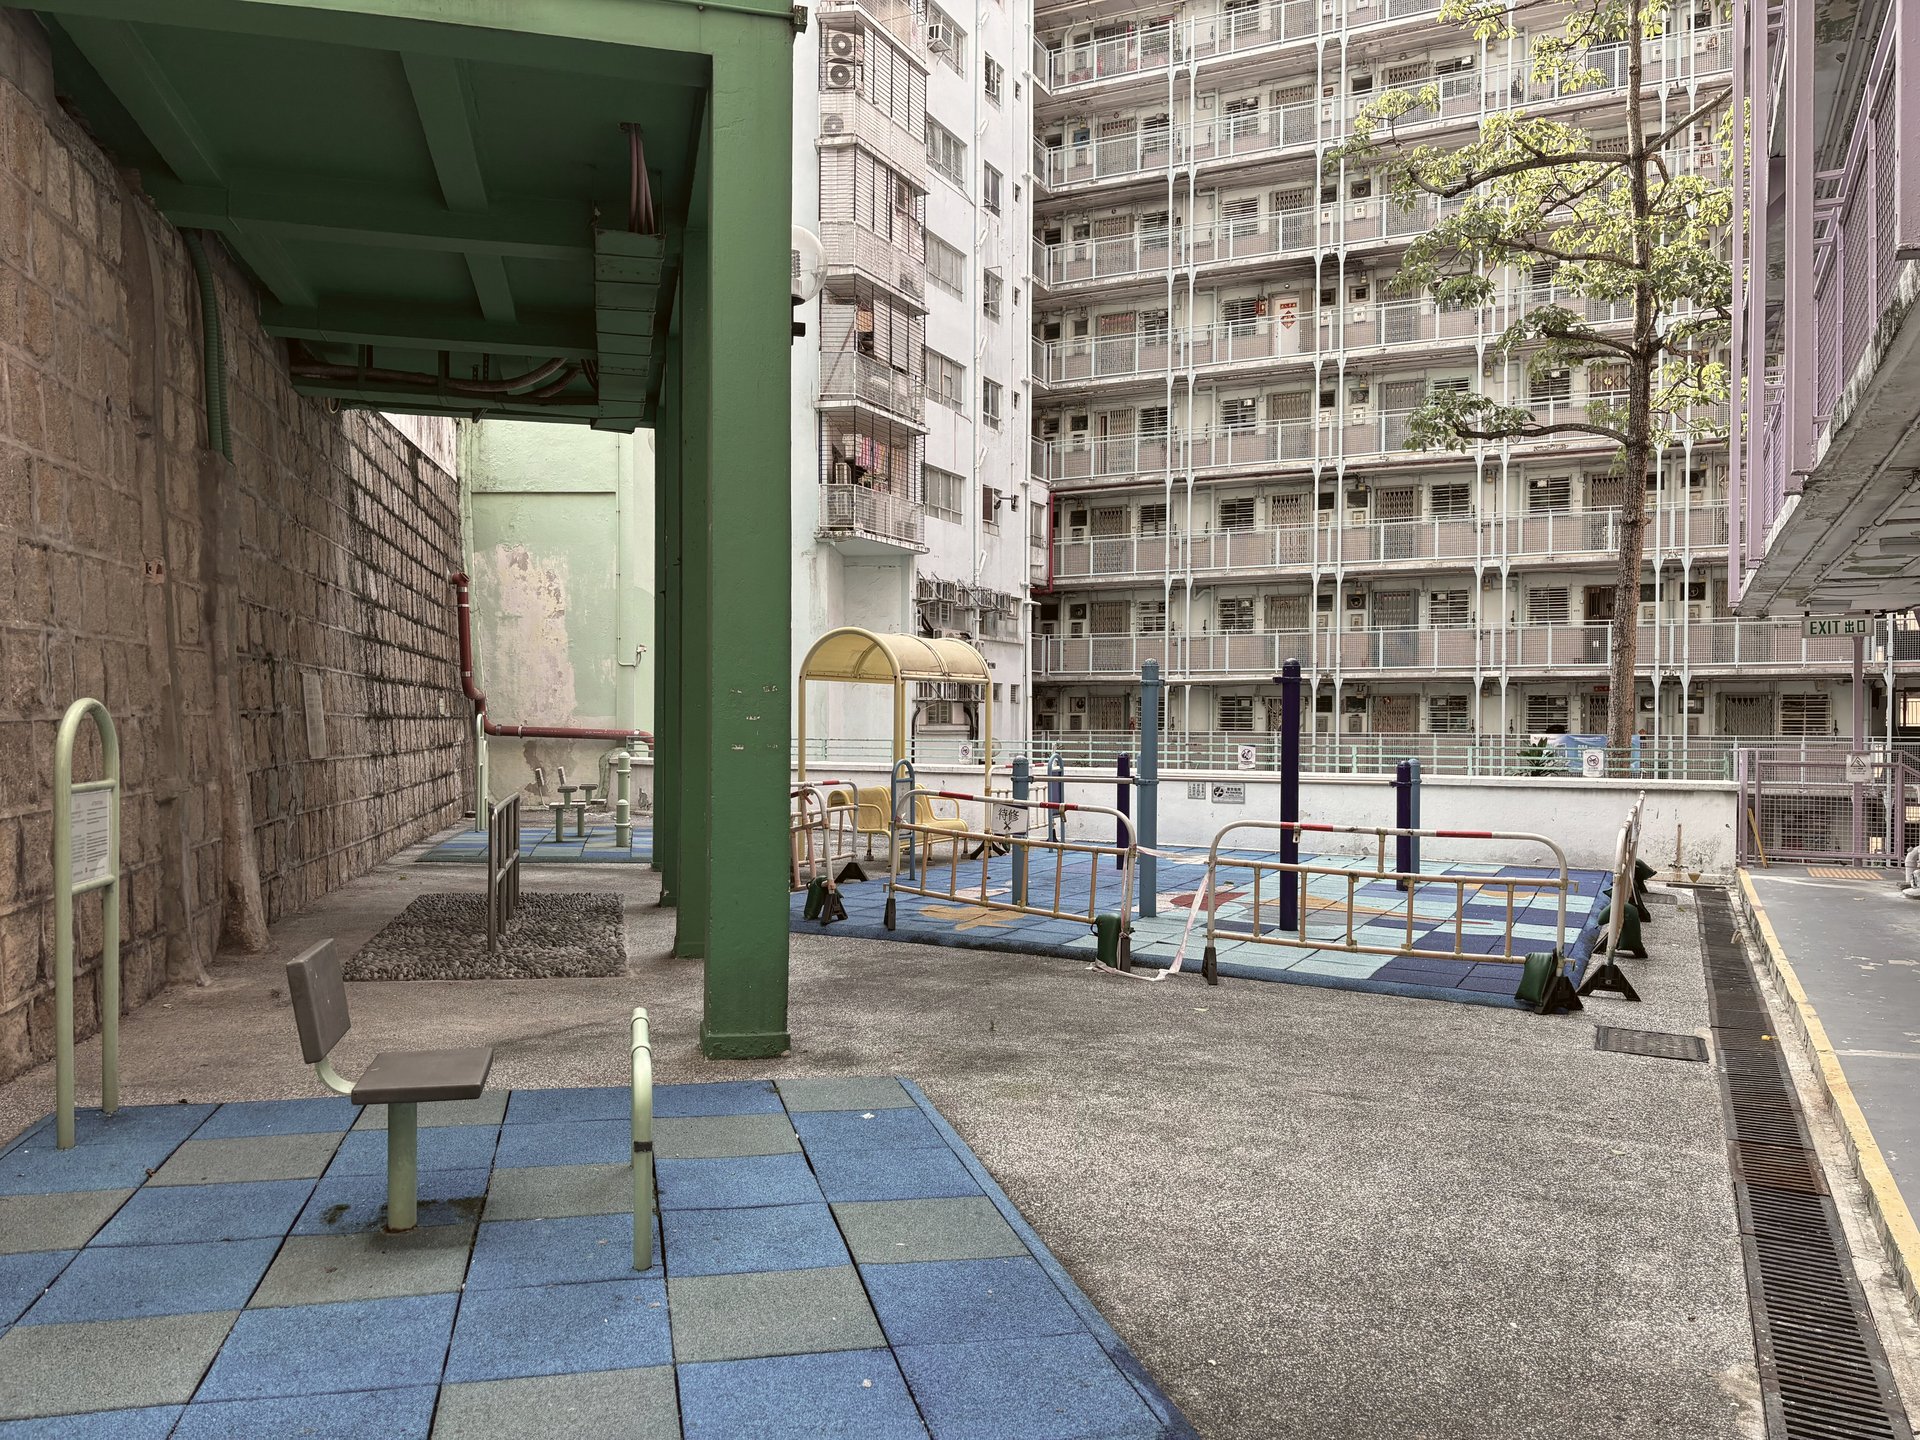
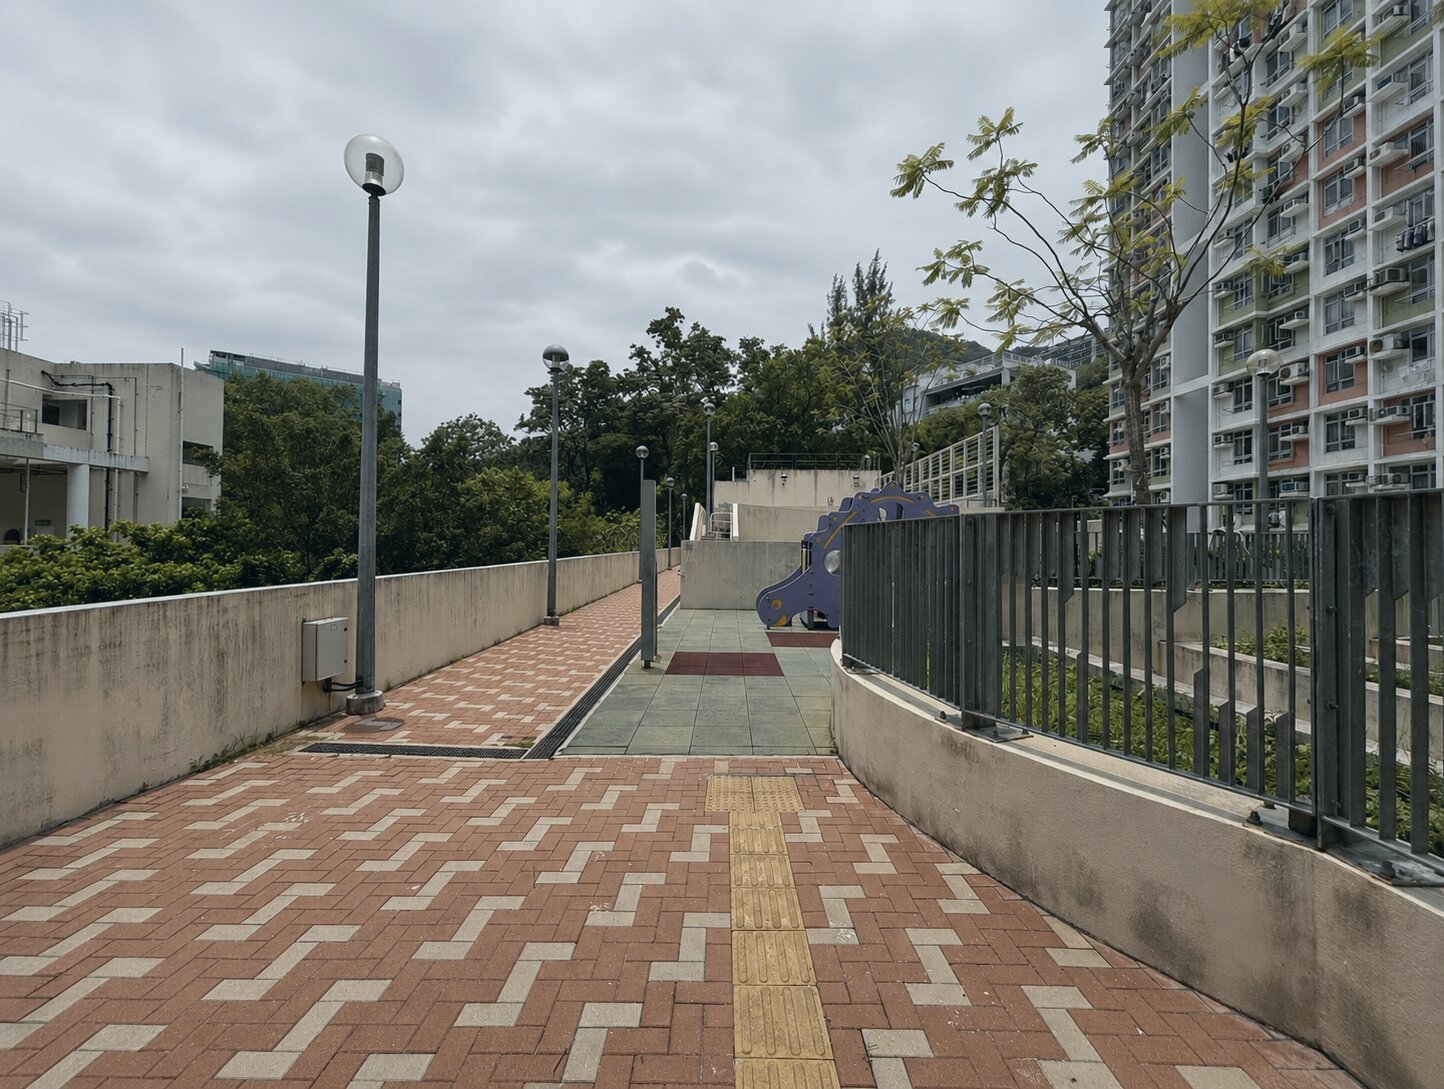
Old versus new — across six spatial typologies.
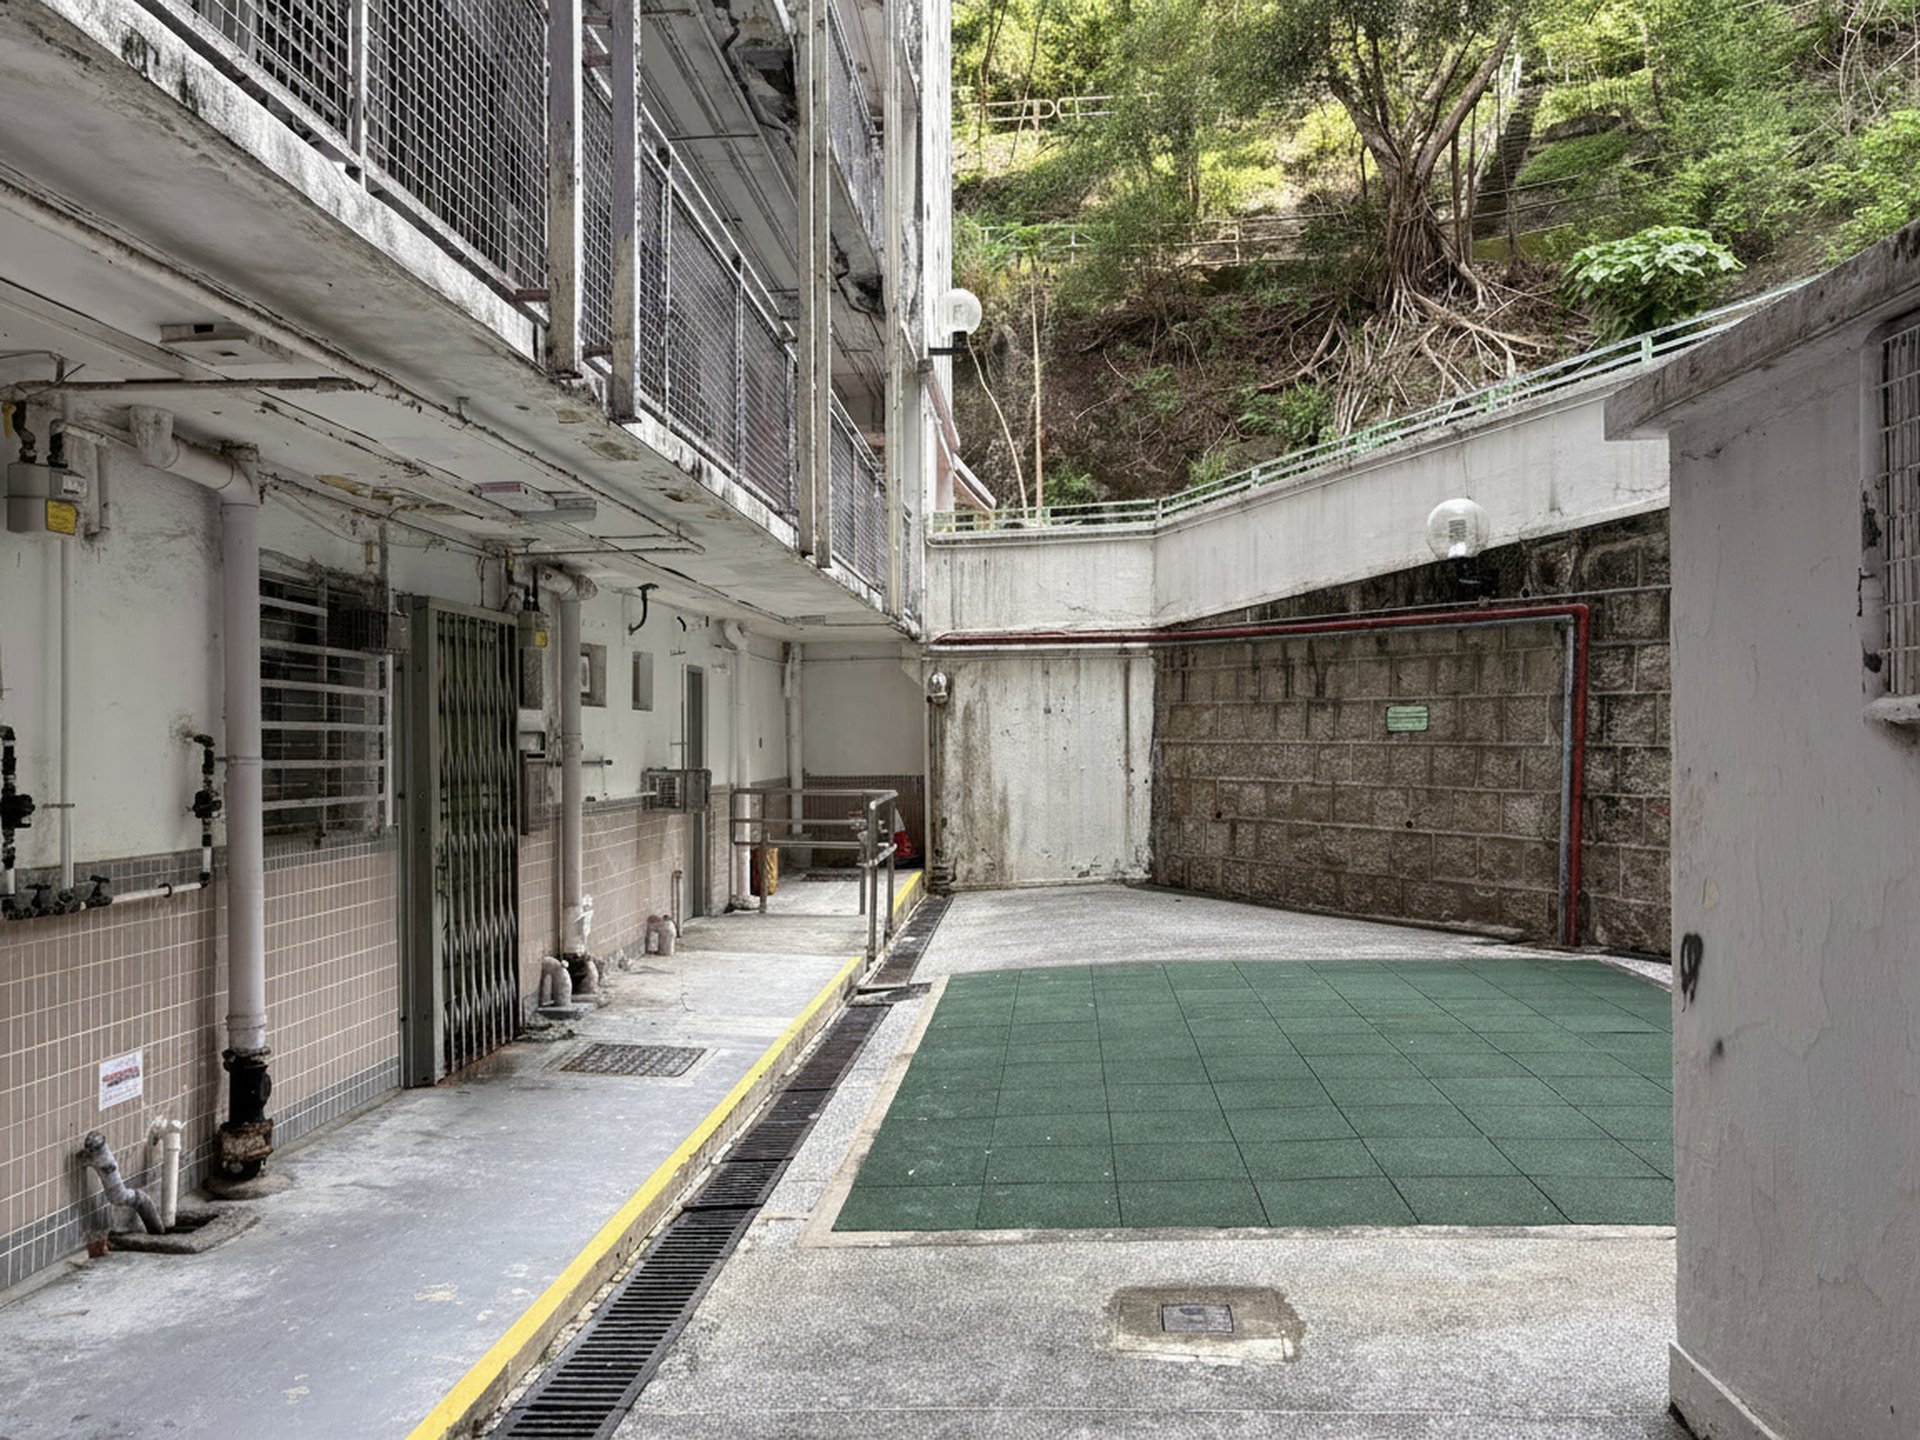
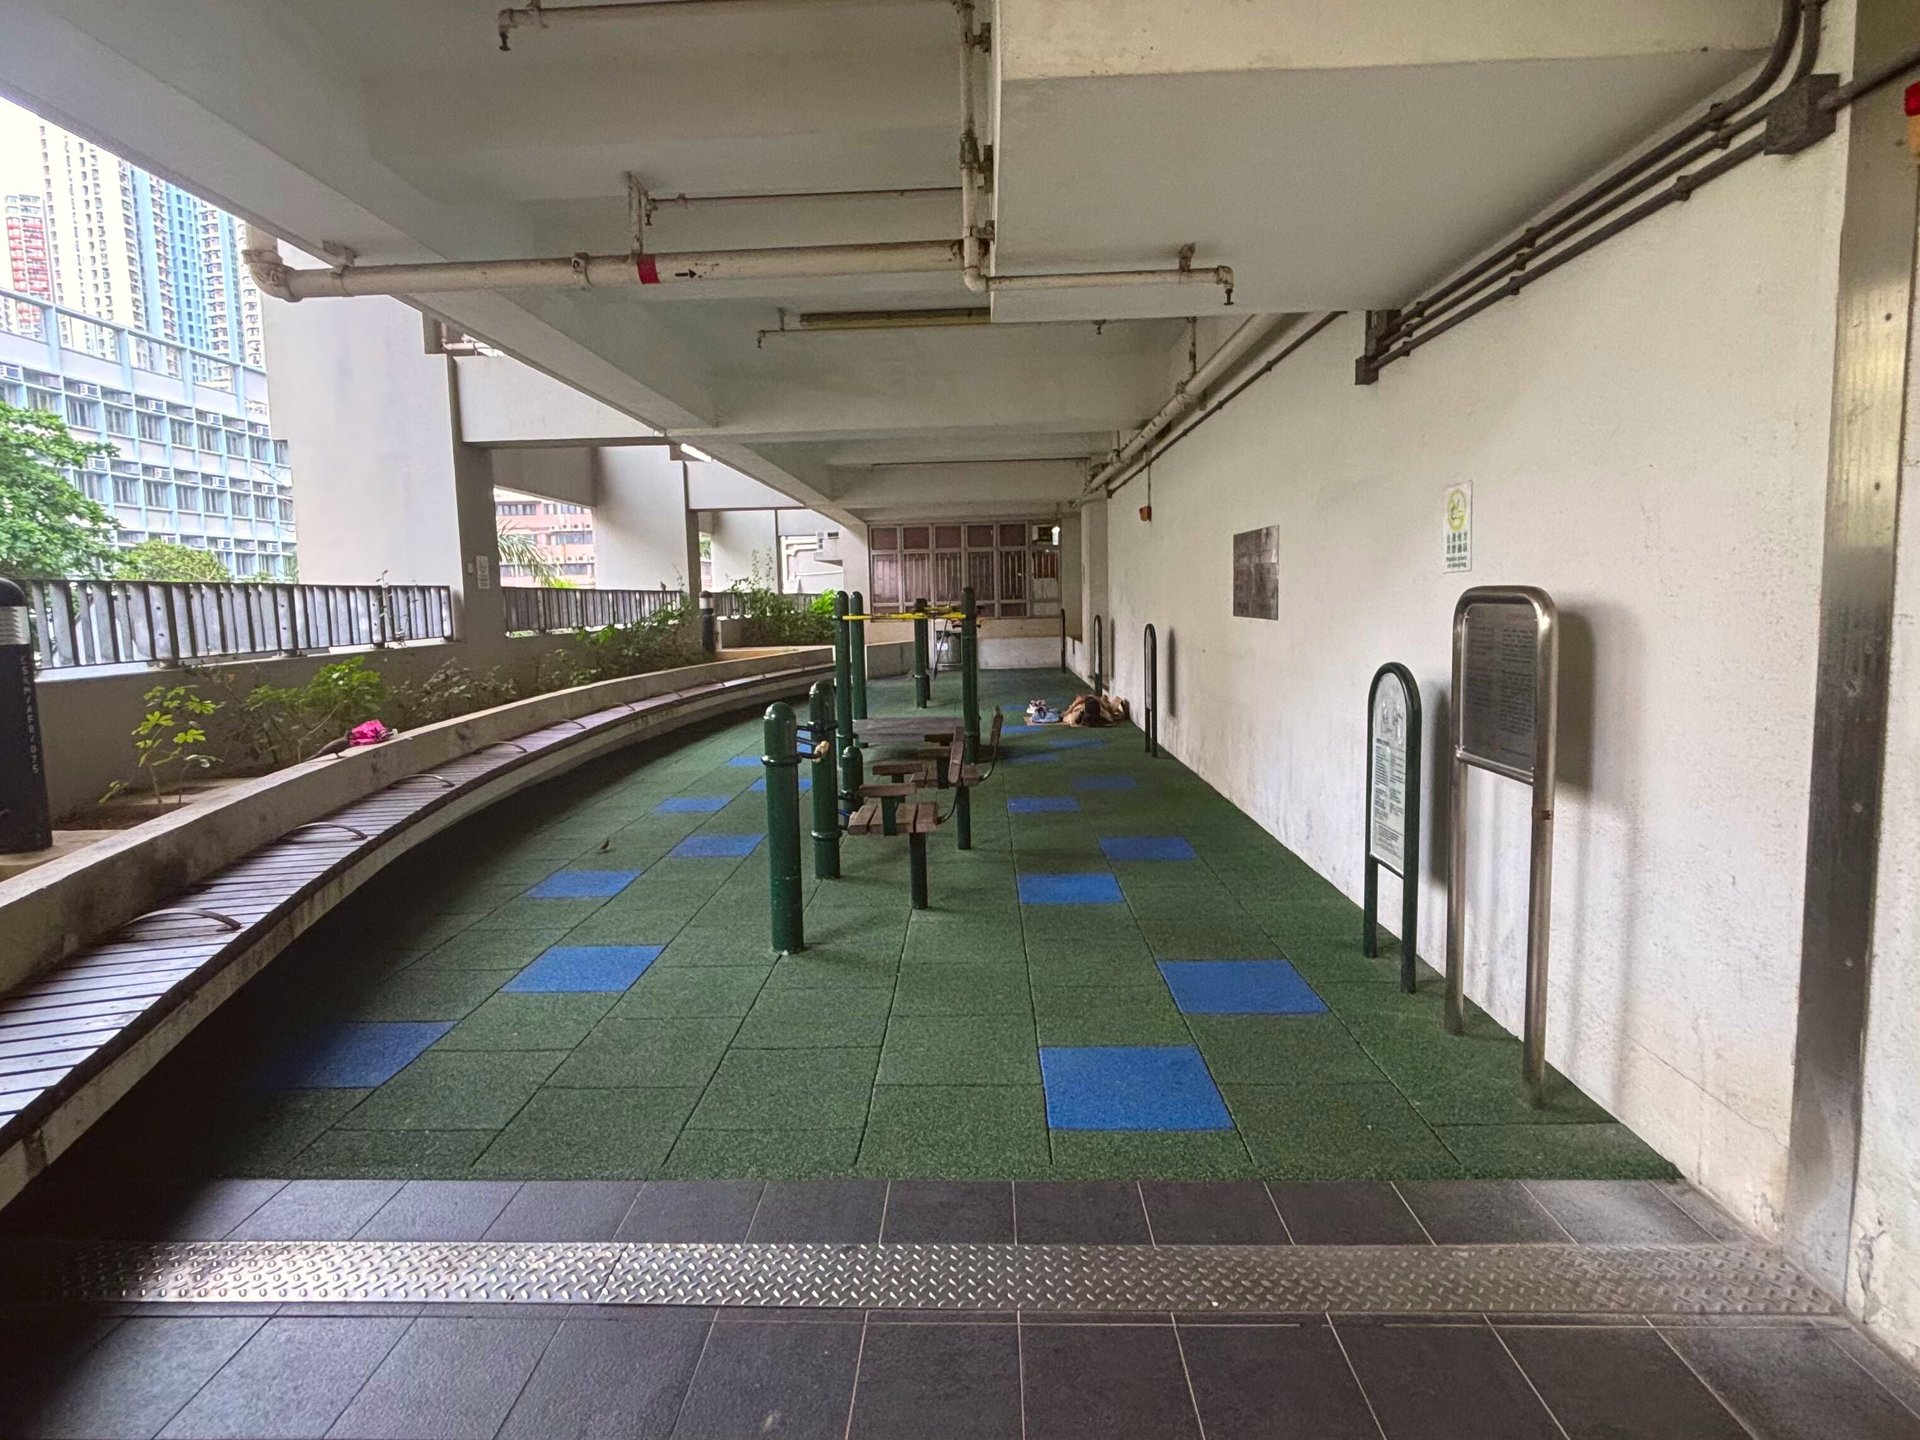
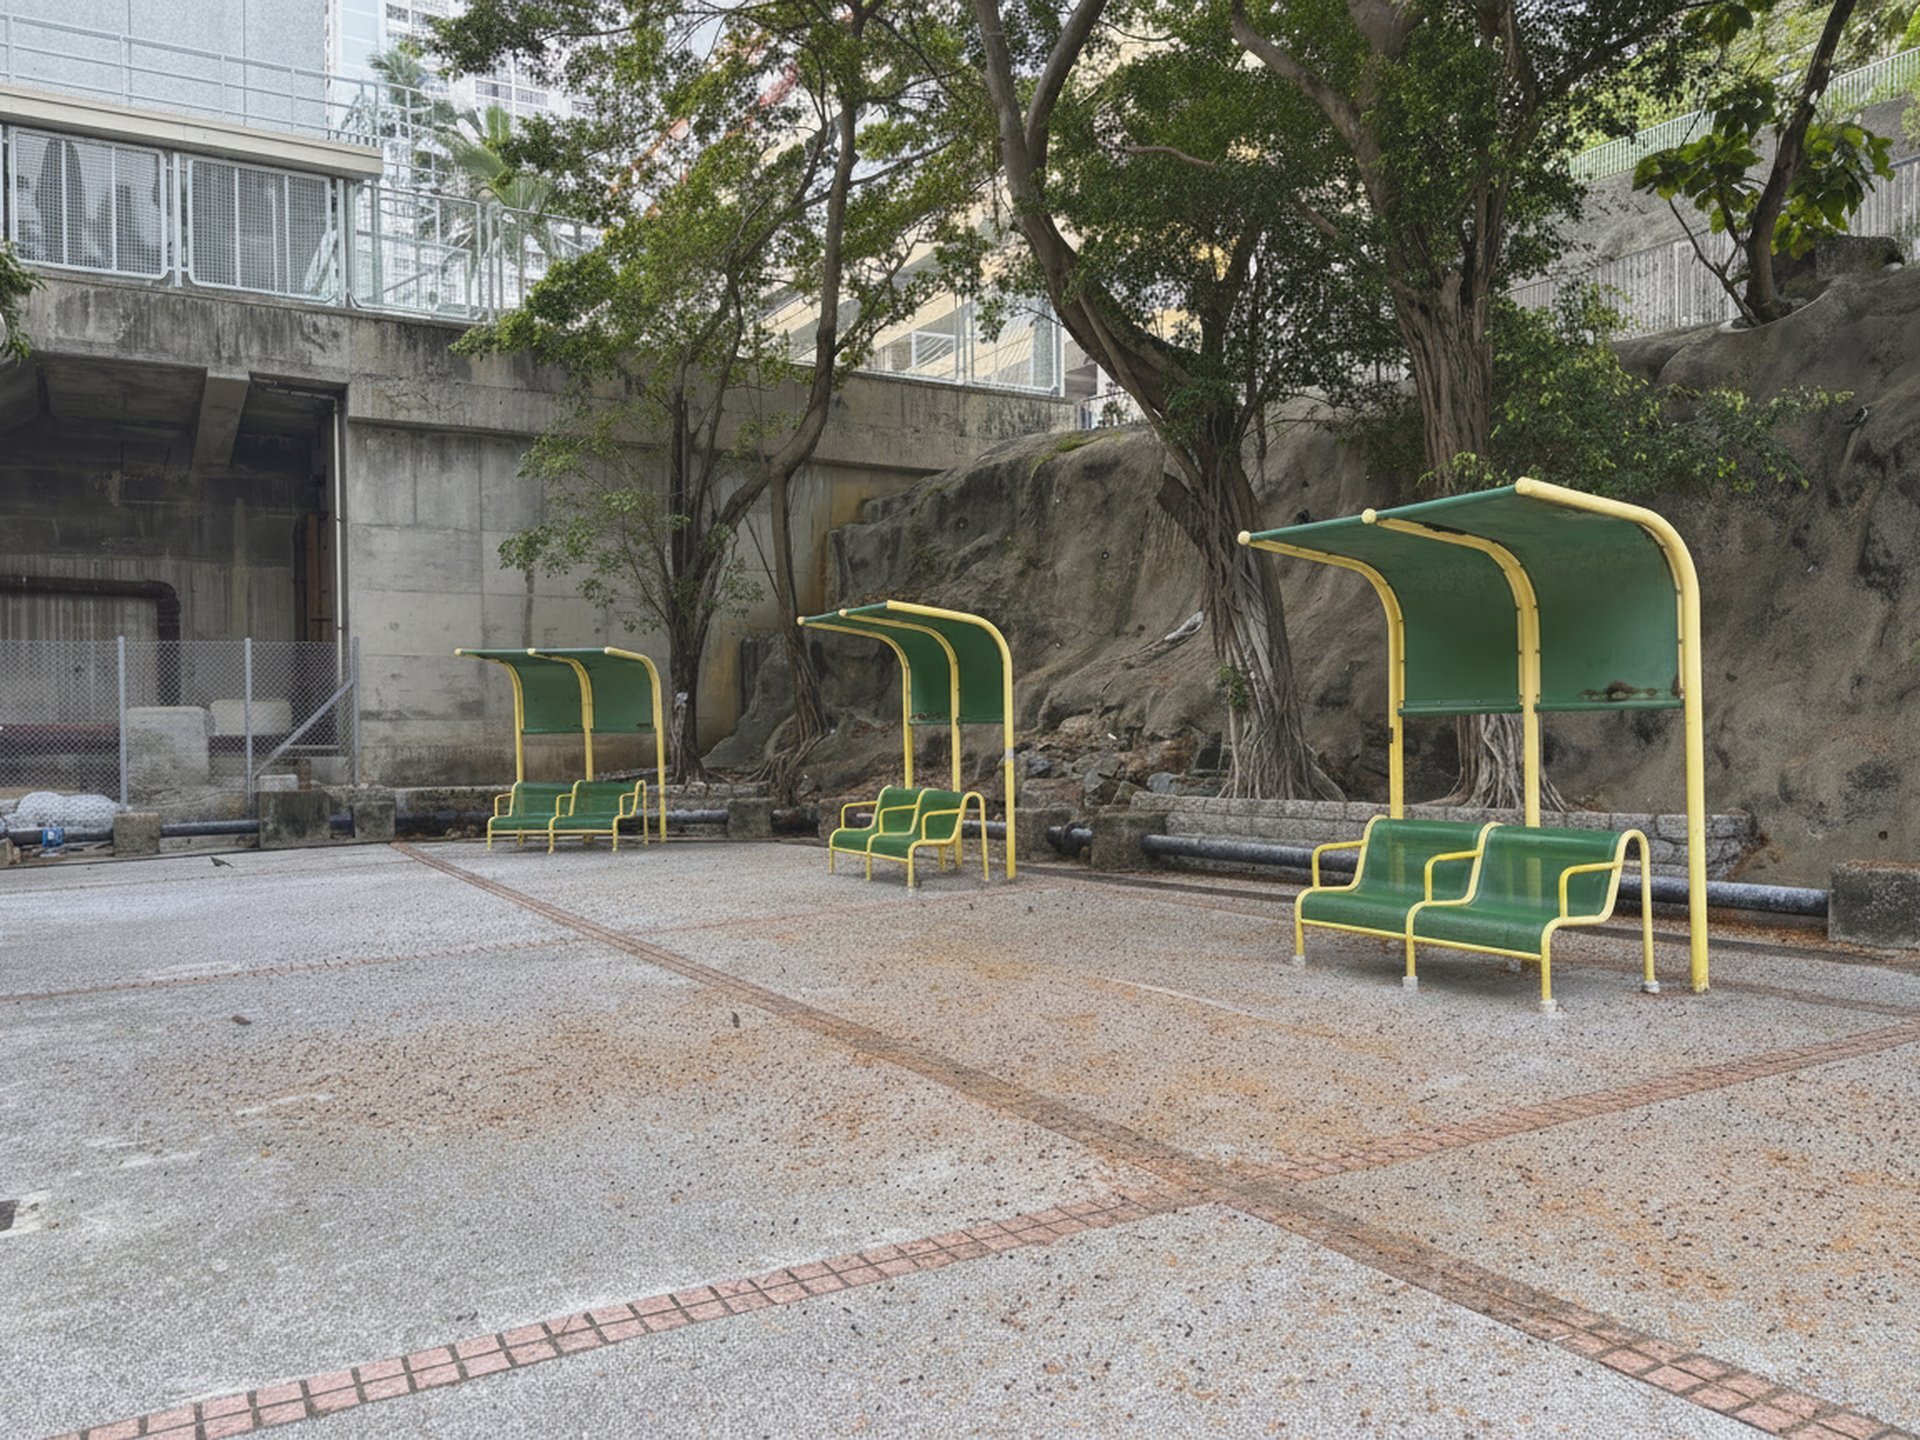
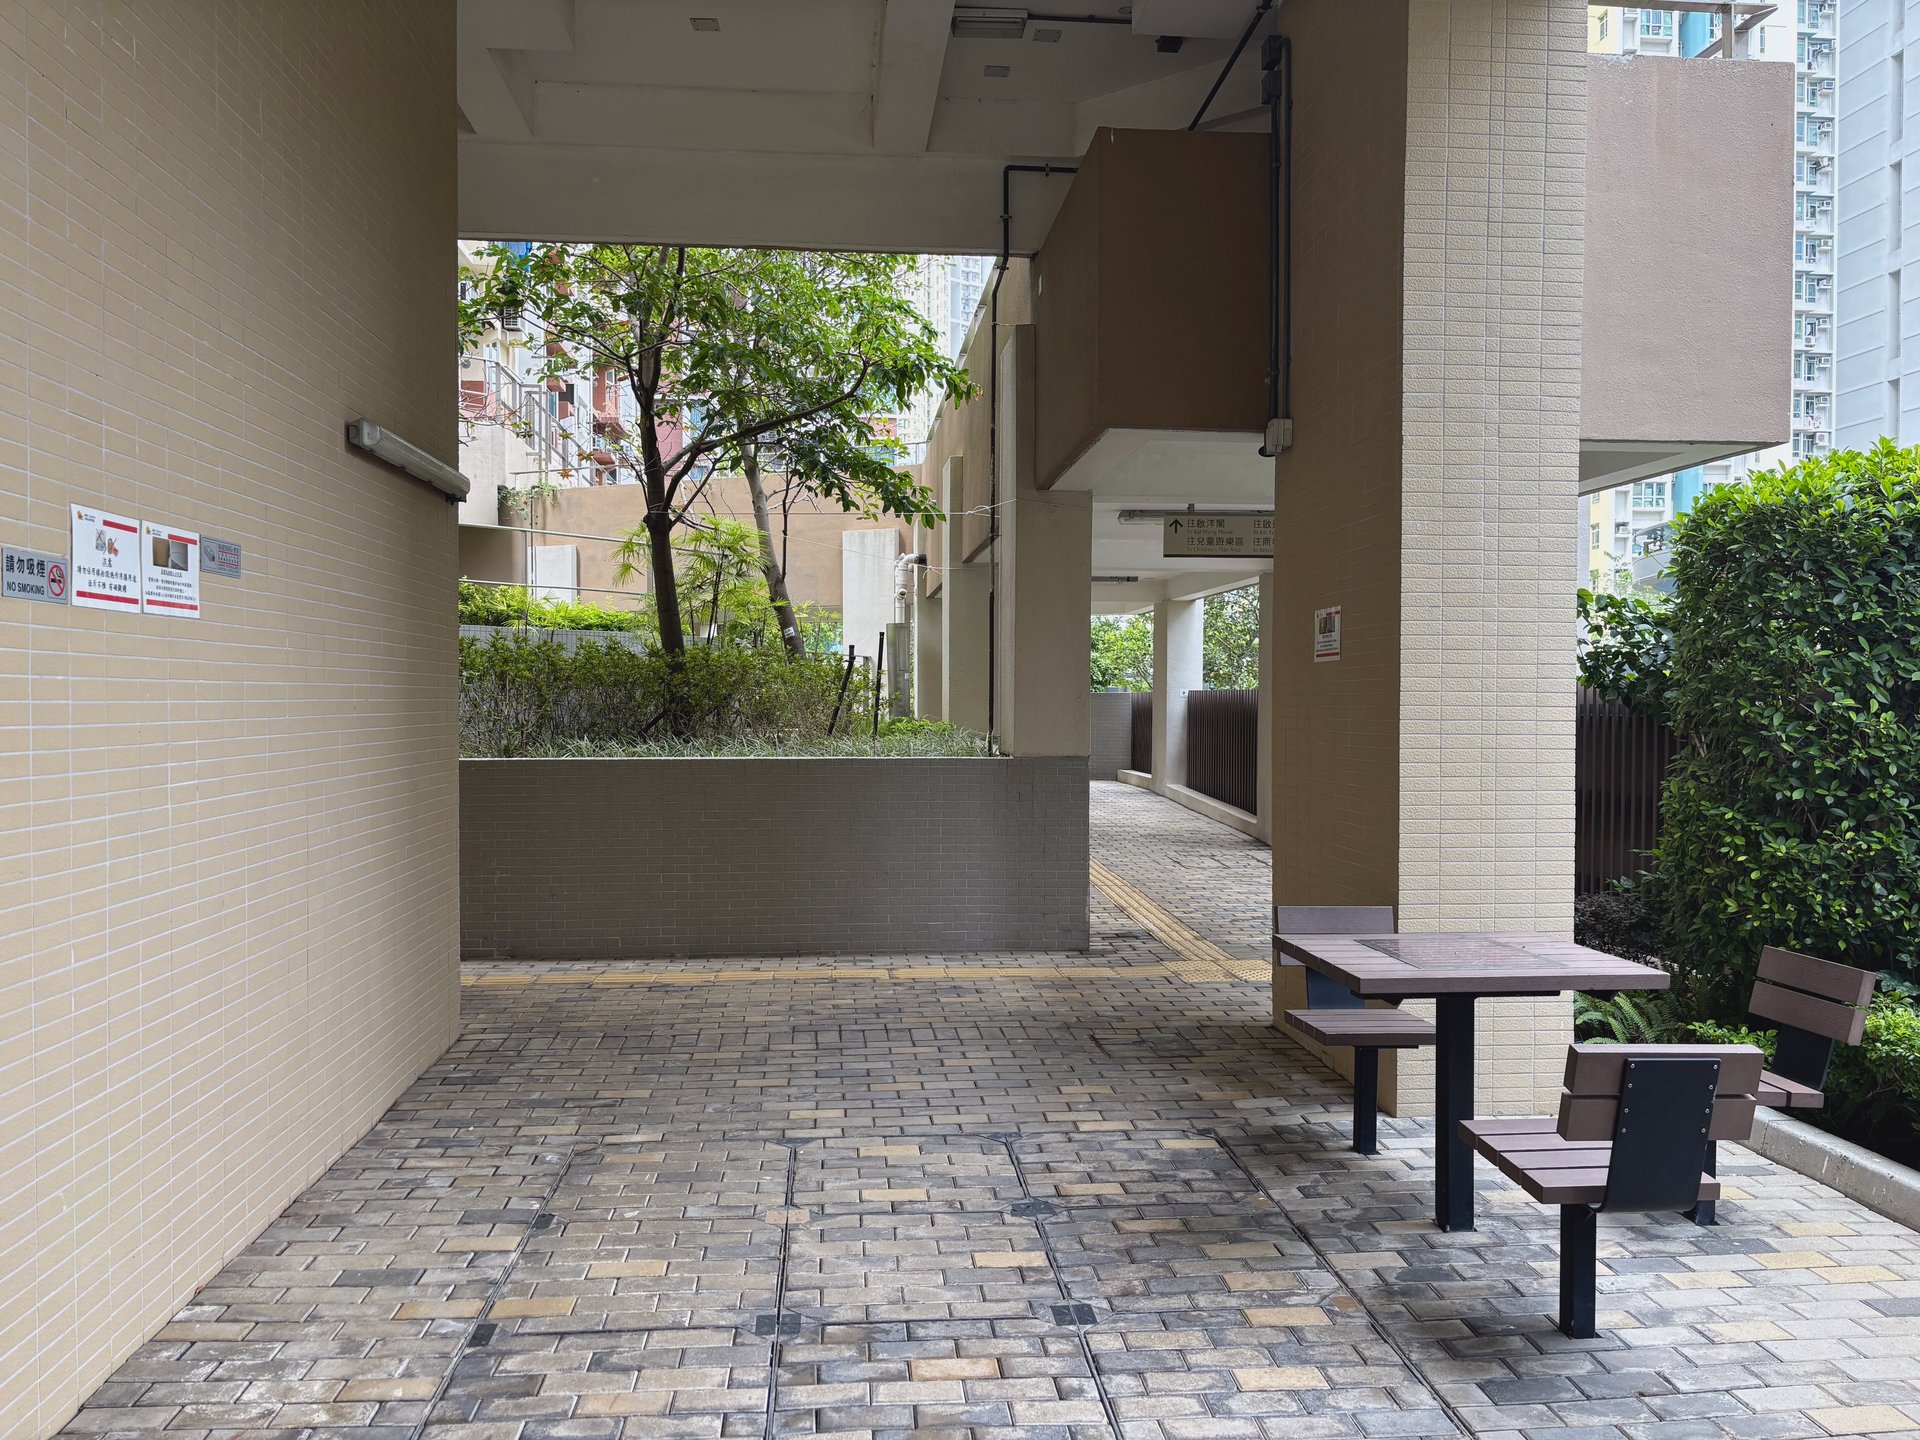
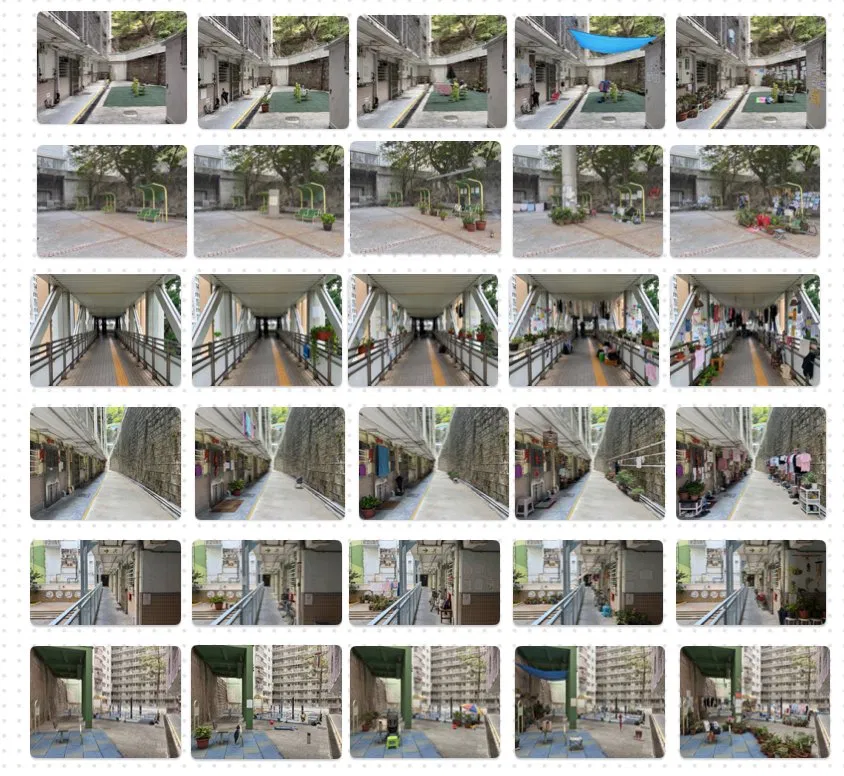
Two old estates (Wah Fu, Sai Wan) and two new ones (New So Uk, Kai Long Court). Each is photographed across the same six kinds of shared space — so we compare like with like, and measuring openness directly separates era from enclosure.
oldnew
Edge
oldnew
Estate pathway
oldnew
Covered pathway
oldnew
Playground
oldnew
Sports ground
oldnew
Sitting-out area
Stimulus preparation
Controlling everything except the building.
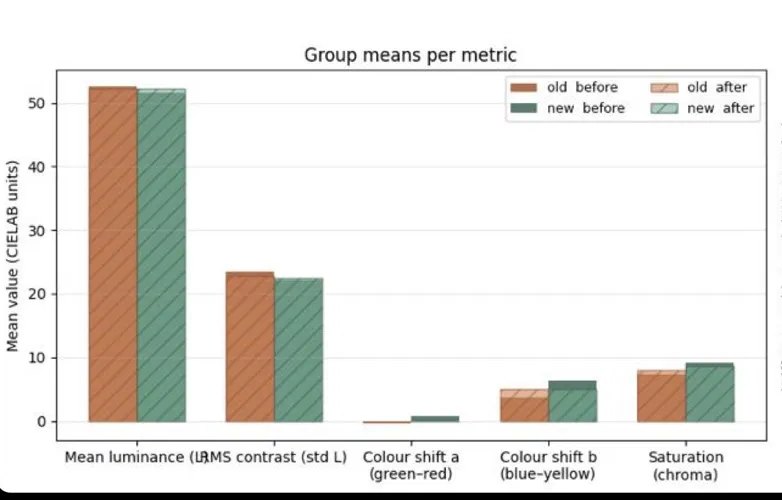
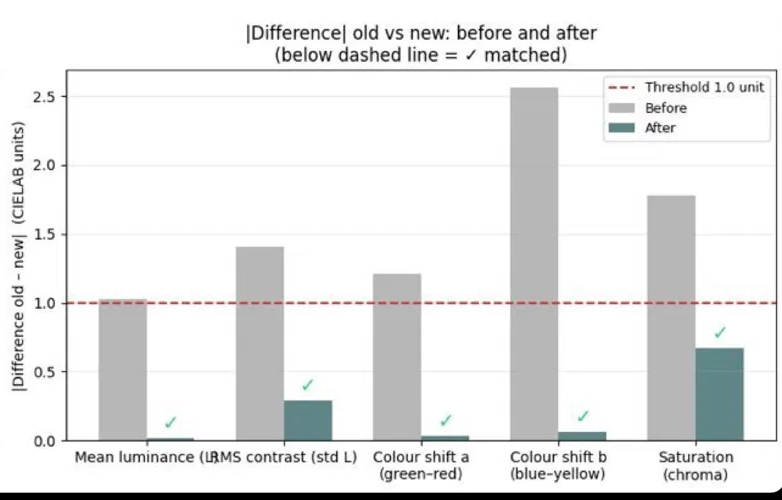
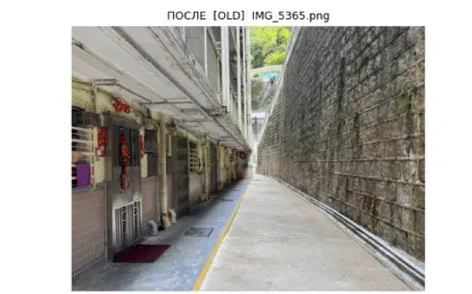
After normalisation, old & new are matched on every property — below the 1-unit threshold (✓).
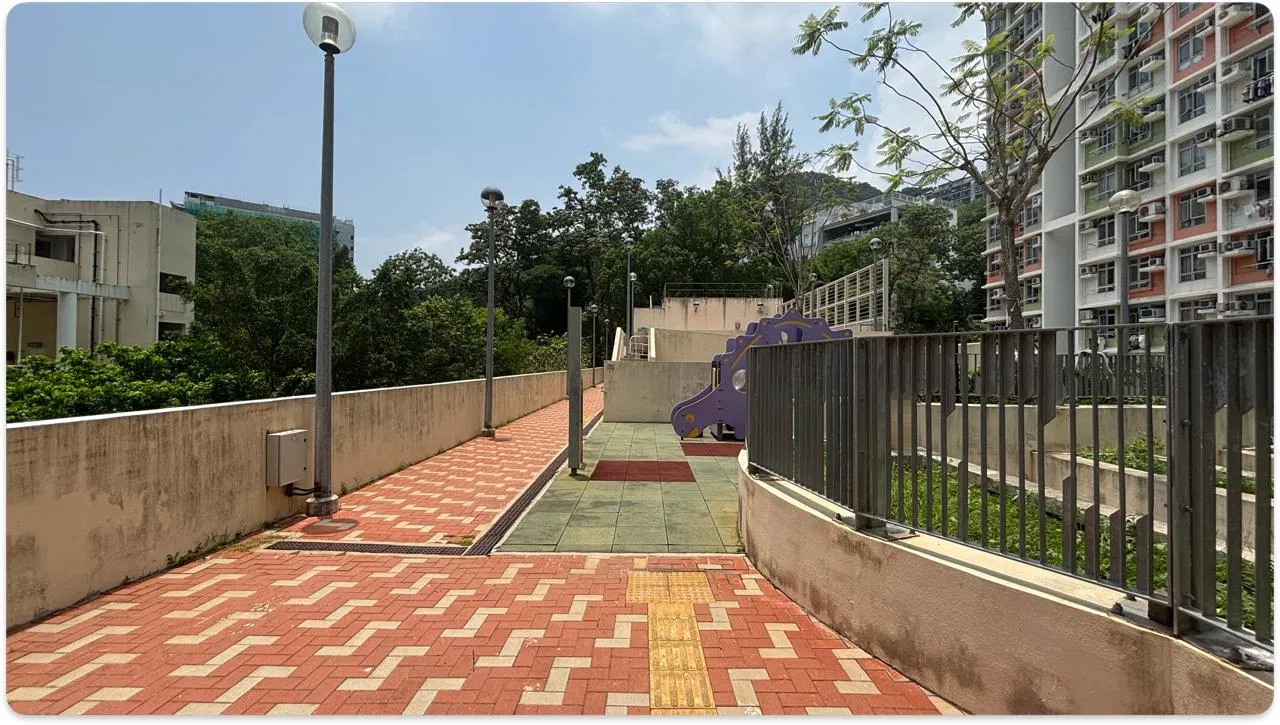
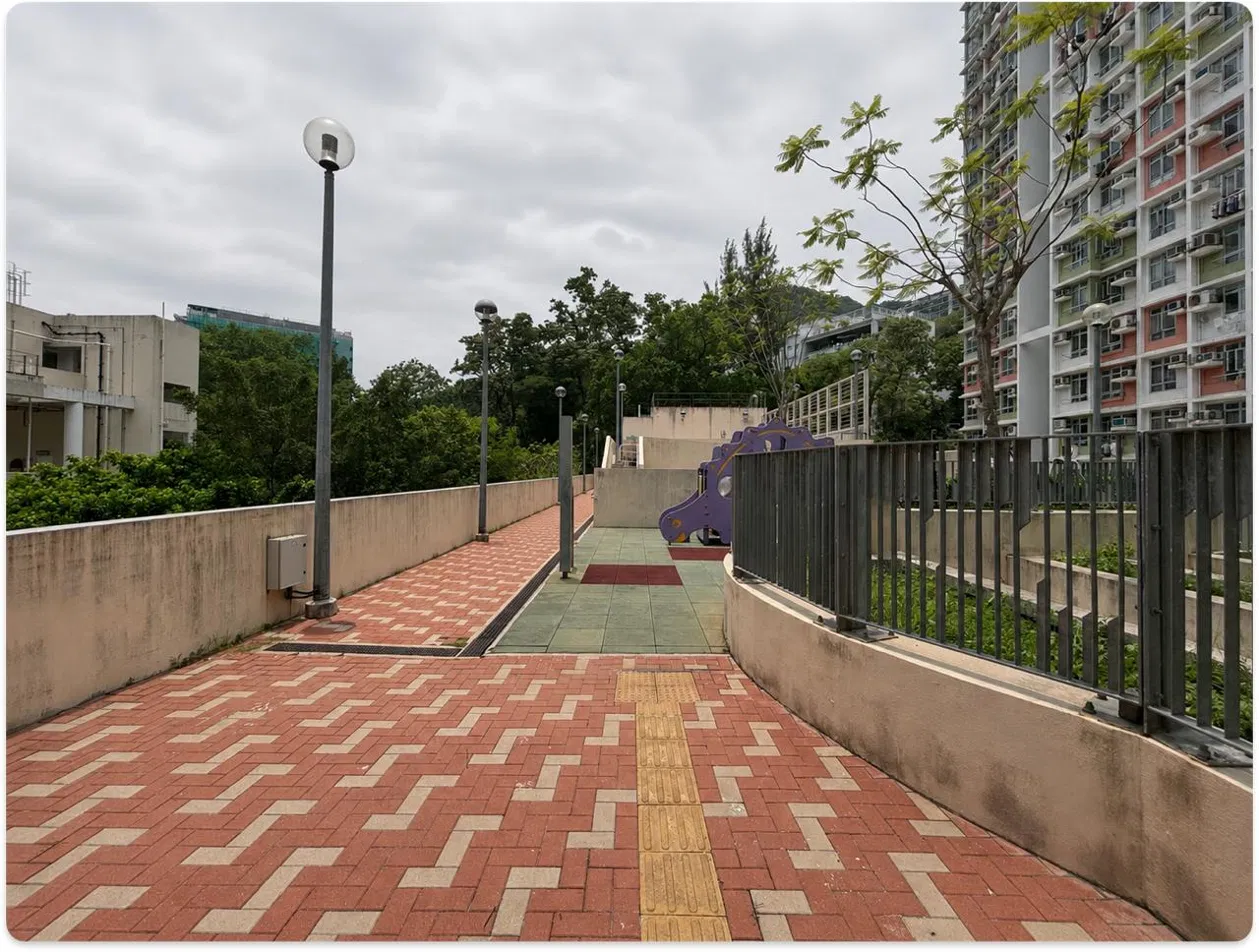
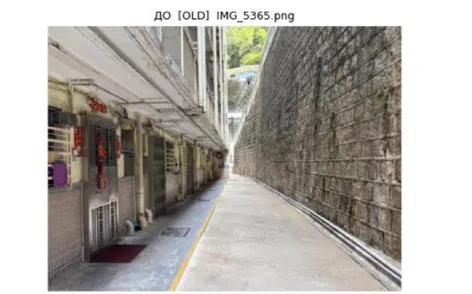
1 Weather varies between days
Same path — sunSame path — overcast
2 Equalised in code — brightness, contrast, colour
BeforeAfter
Isolating the new variable
Building the gradient of inhabitation.
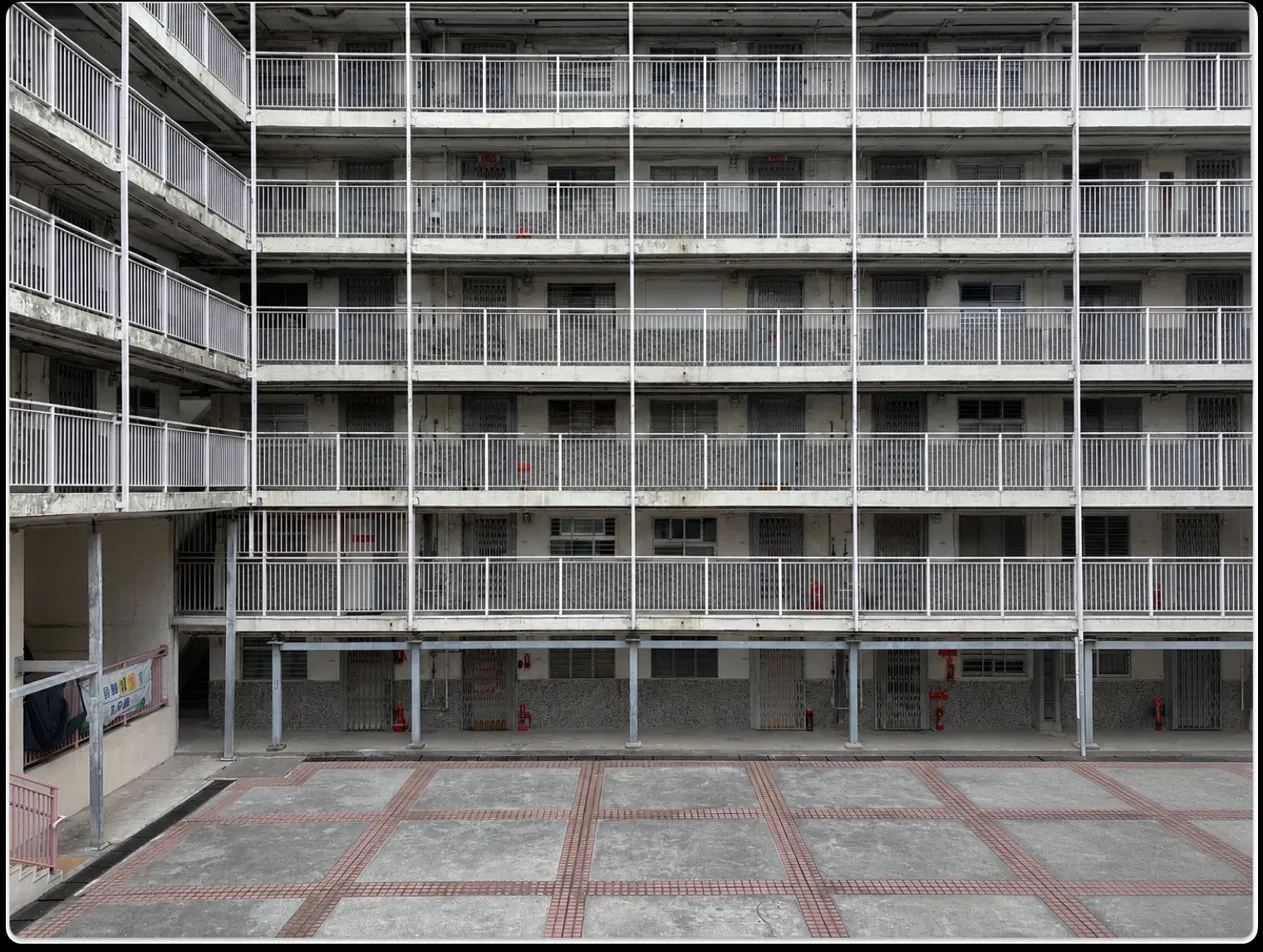
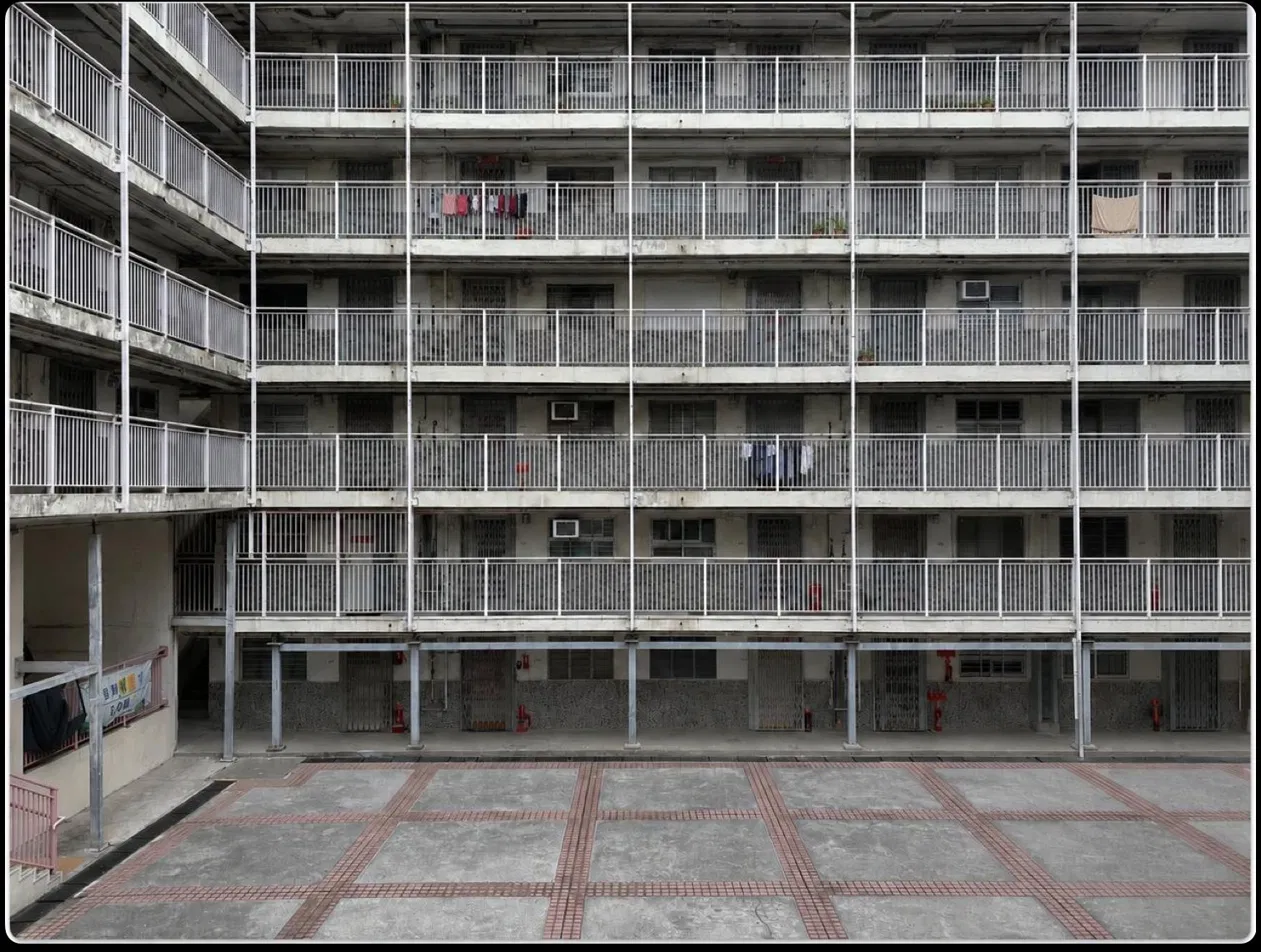
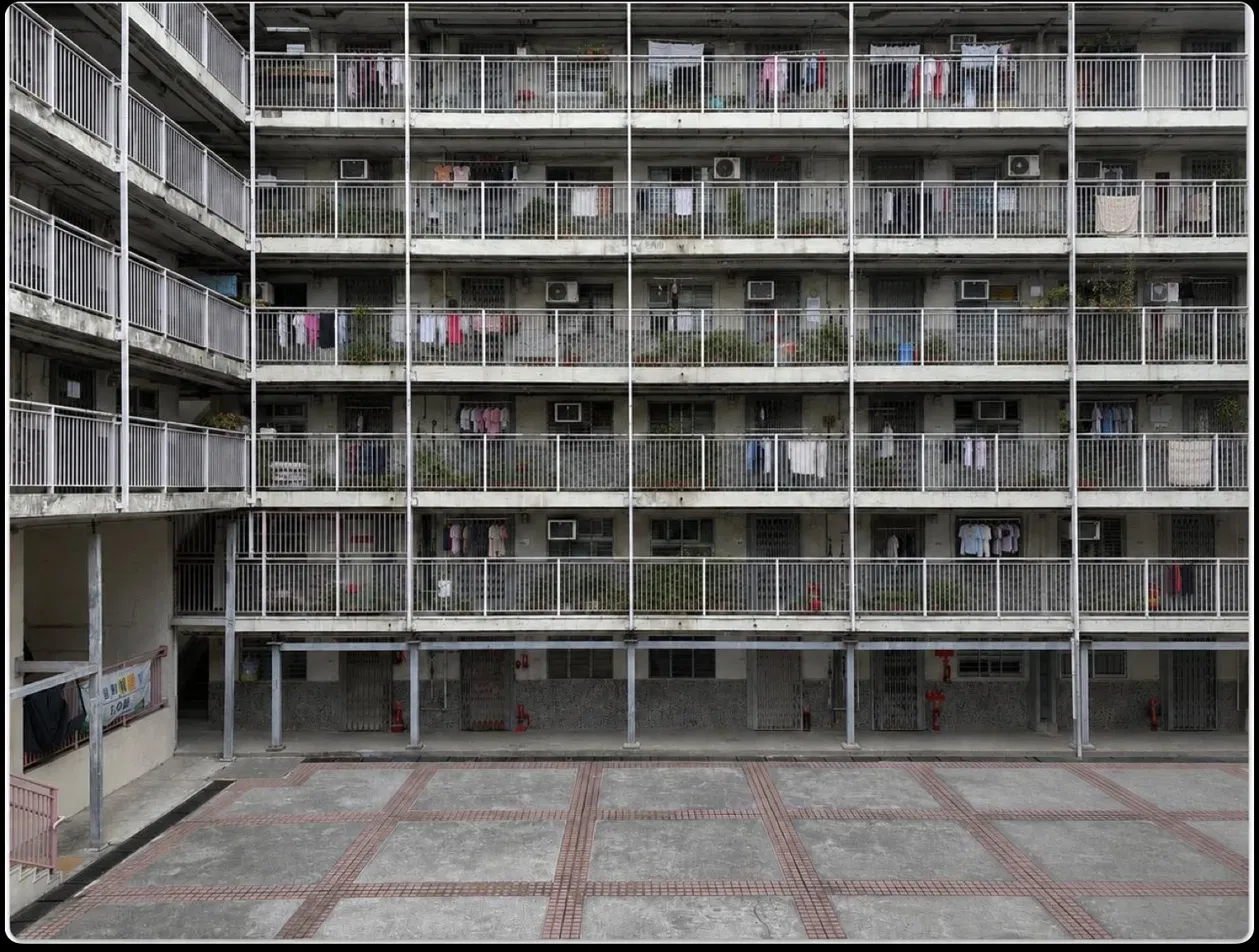
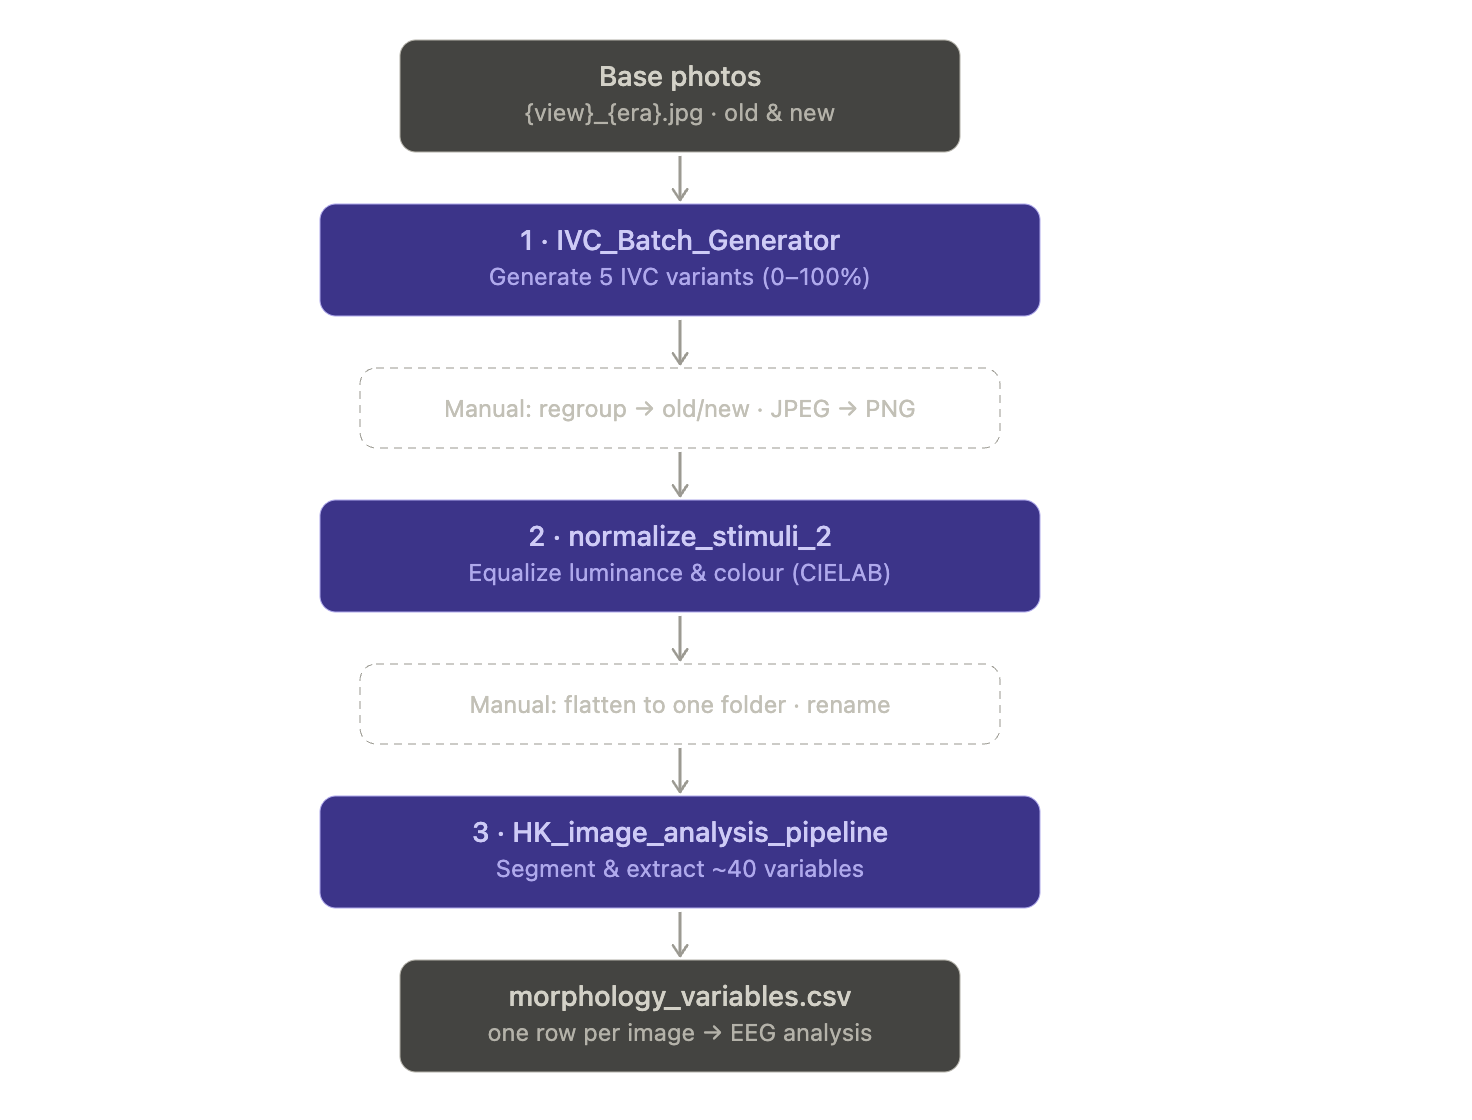
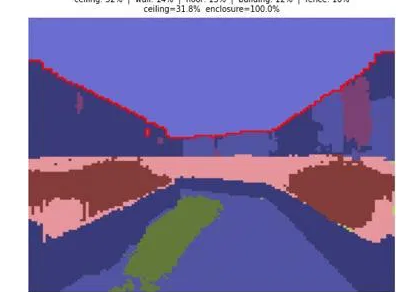
From one base facade, traces of life accumulate step by step — everything else held identical. This lets us test the effect of IVC on its own.
0%
Baseline
33%
Low
66%
Medium
100%
High
Quantified as rising inhabited element density — the count of life-traces per image.
Generated variants are a separate, clearly-labelled condition — the main comparison uses real photographs only.
The same gradient, every typology
Five levels of IVC, across all six typologies.
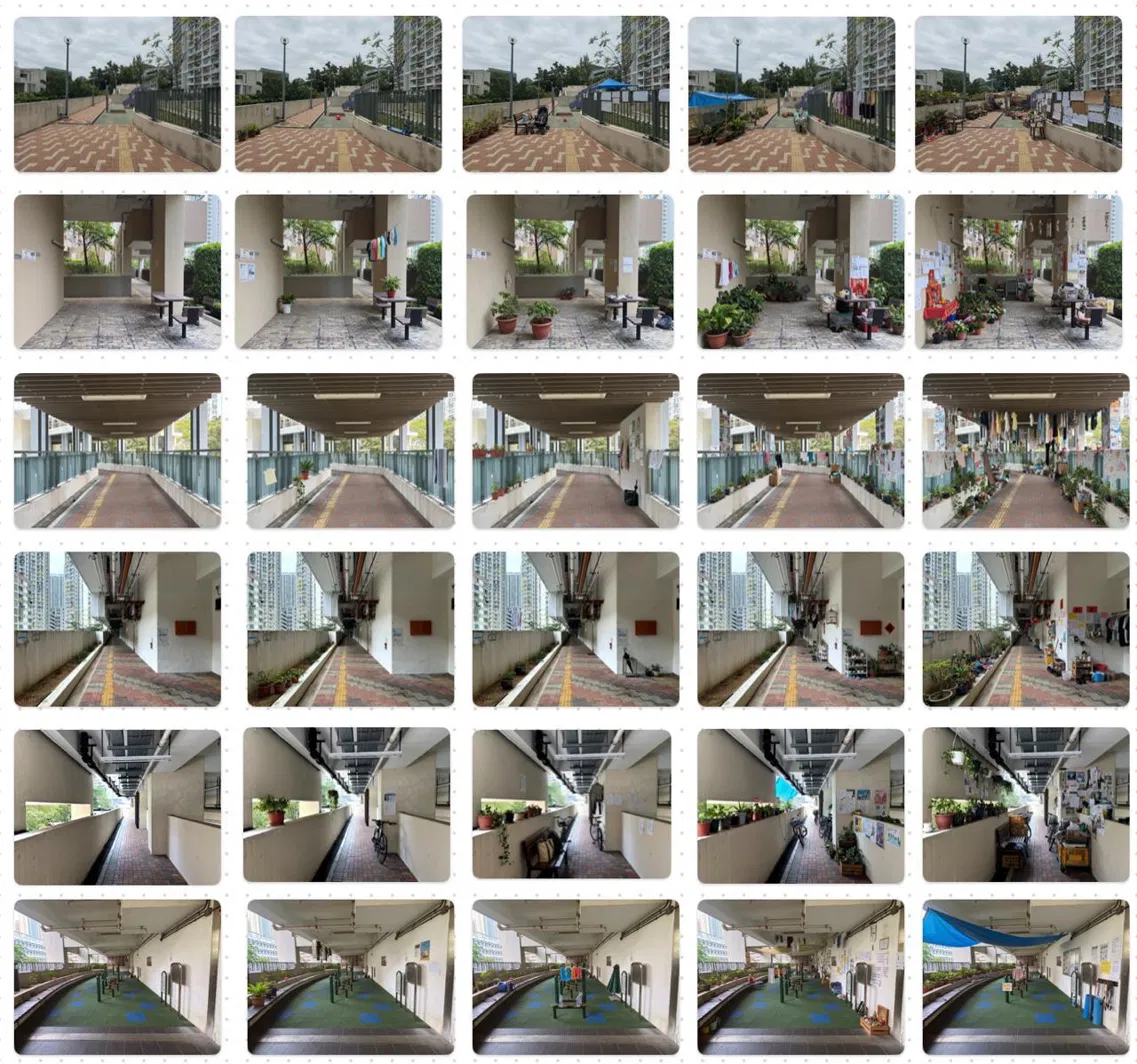
The inhabitation gradient isn't only for facades — it's generated for every spatial typology, each at five levels (0 → 100%). Rows are typologies; columns step from empty to densely inhabited.
Typologies shown: edge · estate pathway · covered pathway · playground · sports ground · sitting-out area — left columns empty, right columns fully lived-in.
The processing pipeline · code
Three scripts turn photos into a dataset.
Every photograph runs through a fixed, reproducible chain — two automated scripts and a final analysis stage, with light manual regrouping in between:
1
IVC_Batch_Generator generates 5 inhabitation variants (0–100%) per base view.
2
normalize_stimuli_2 equalises luminance & colour in CIELAB so era is the only variable.
3
HK_image_analysis_pipeline segments each image & extracts ~40 morphological variables.
Output: morphology_variables.csv — one row per image, fed straight into the EEG analysis.
From photo to data
How each image becomes numbers.
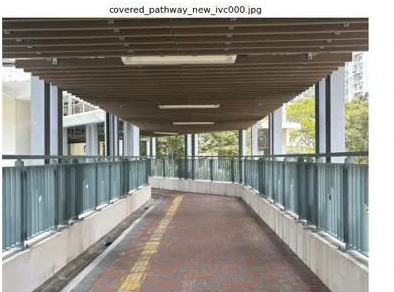
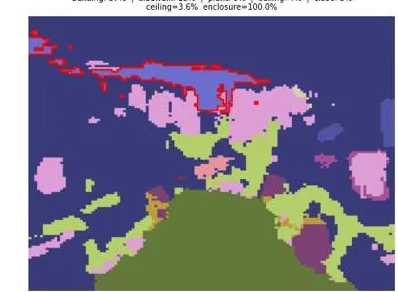
Every photo is segmented pixel-by-pixel by a vision model, then turned into ~20 morphological variables. The segmentation already sees the difference between an empty and an inhabited space.
Sky, green, enclosure, height, permeability, human scale.
Visual complexity
Entropy, edge density, clutter, facade rhythm.
New — traces of life
Inhabited element density, patina, visual entropy.
Photo characteristics as variables · manipulation check
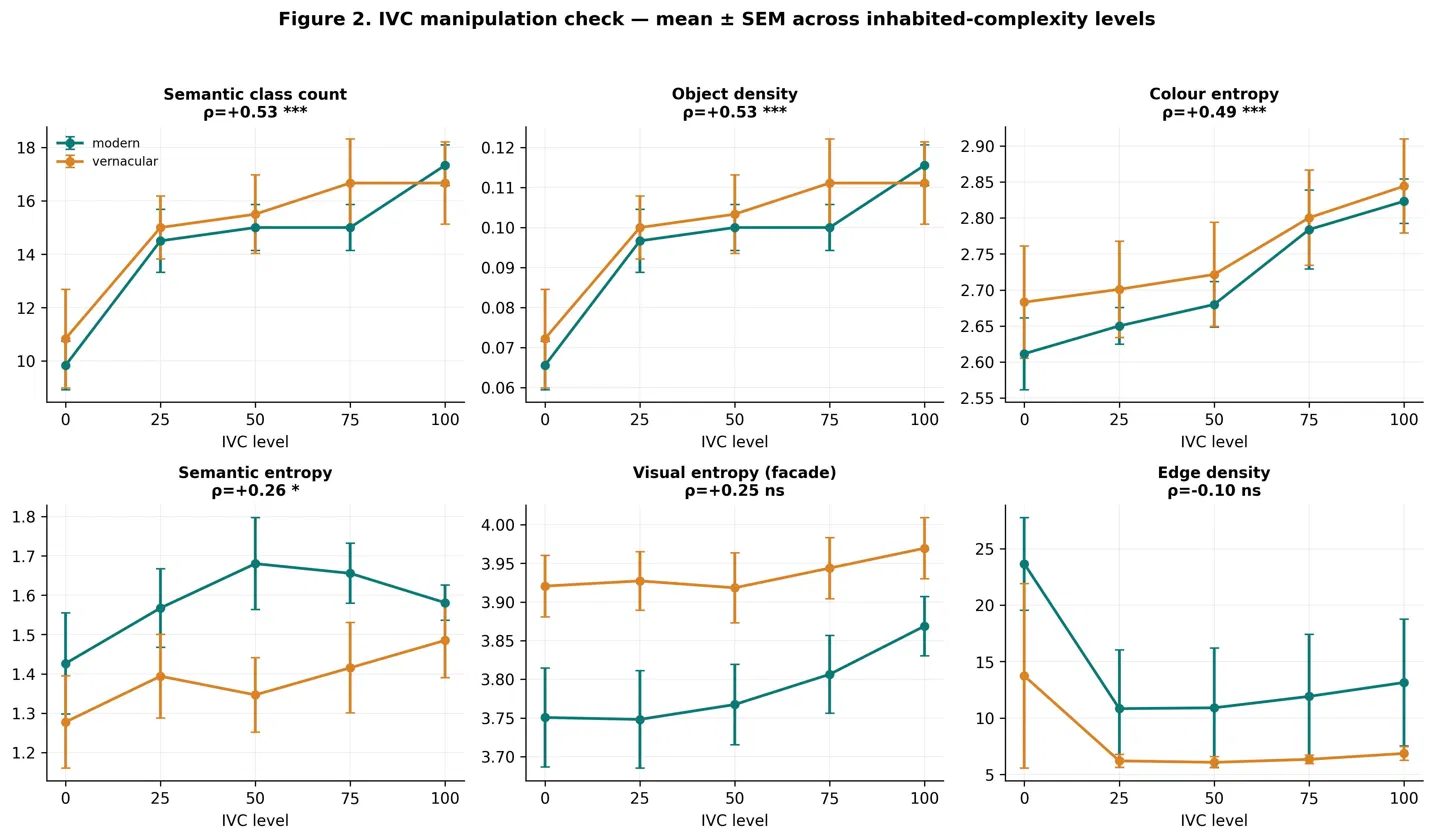
The traces of life show up in the numbers.
The gradient is real
Semantic class count (ρ +0.53***), object density (+0.53***) and colour entropy (+0.49***) all climb with IVC — the manipulation does what it claims.
Richness, not noise
Edge density actually falls (−0.10 ns): added life reads as objects and colour, not raw visual clutter.
Holds for both eras
Modern and vernacular facades follow the same upward curve — a shared, controlled scale of inhabitation.
Photo characteristics as variables · era differences
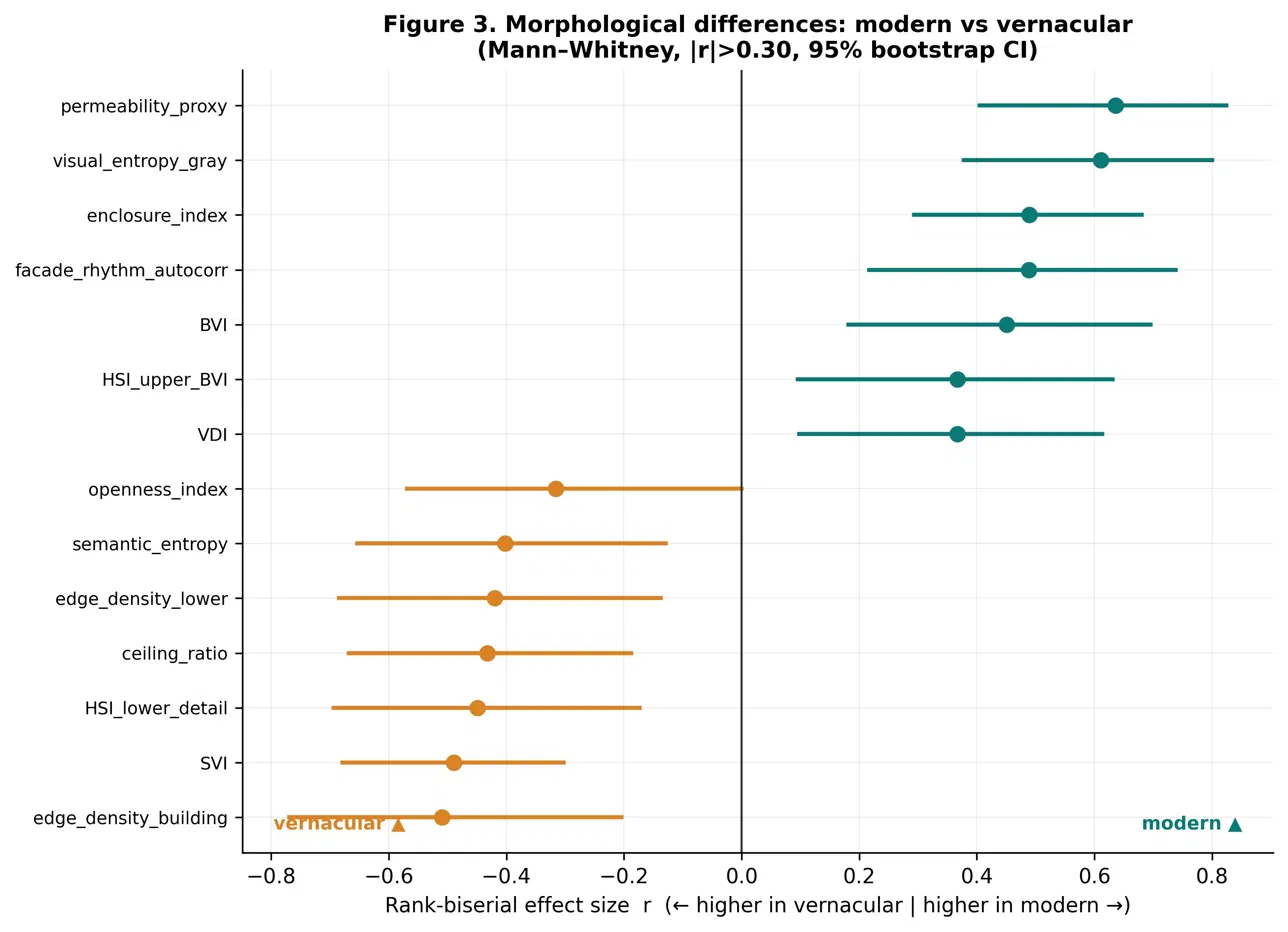
Old and new have distinct morphological signatures.
Modern estates score higher on permeability, visual entropy, enclosure, facade rhythm and building bulk (BVI / VDI).
Vernacular (old) estates score higher on openness, semantic entropy, edge density, sky view and ceiling cover.
Every difference shown clears |r| > 0.30 with a 95% bootstrap CI — the two eras are genuinely, measurably different kinds of space.
Photo characteristics as variables · structure
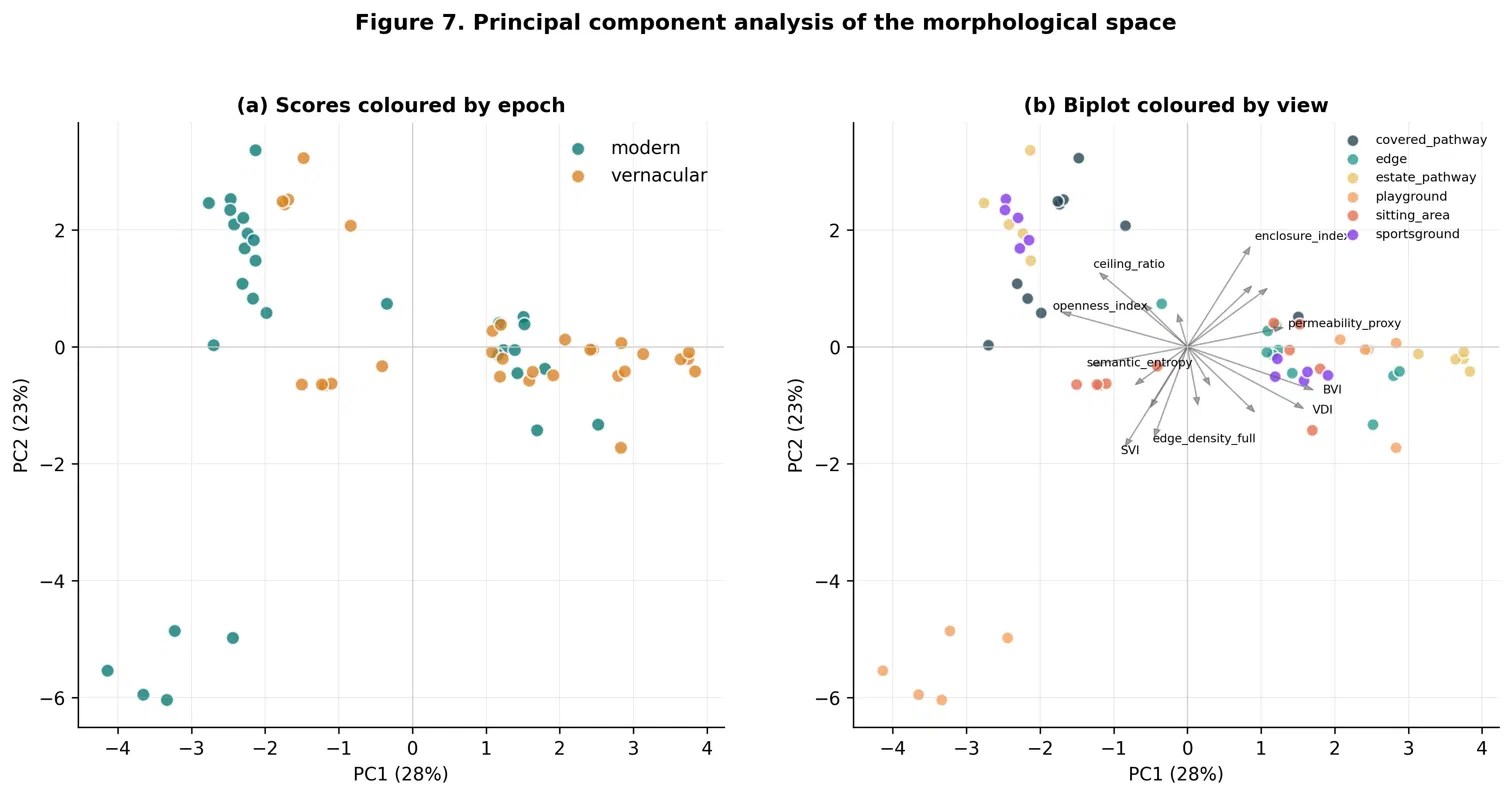
Two eras, one morphological map.
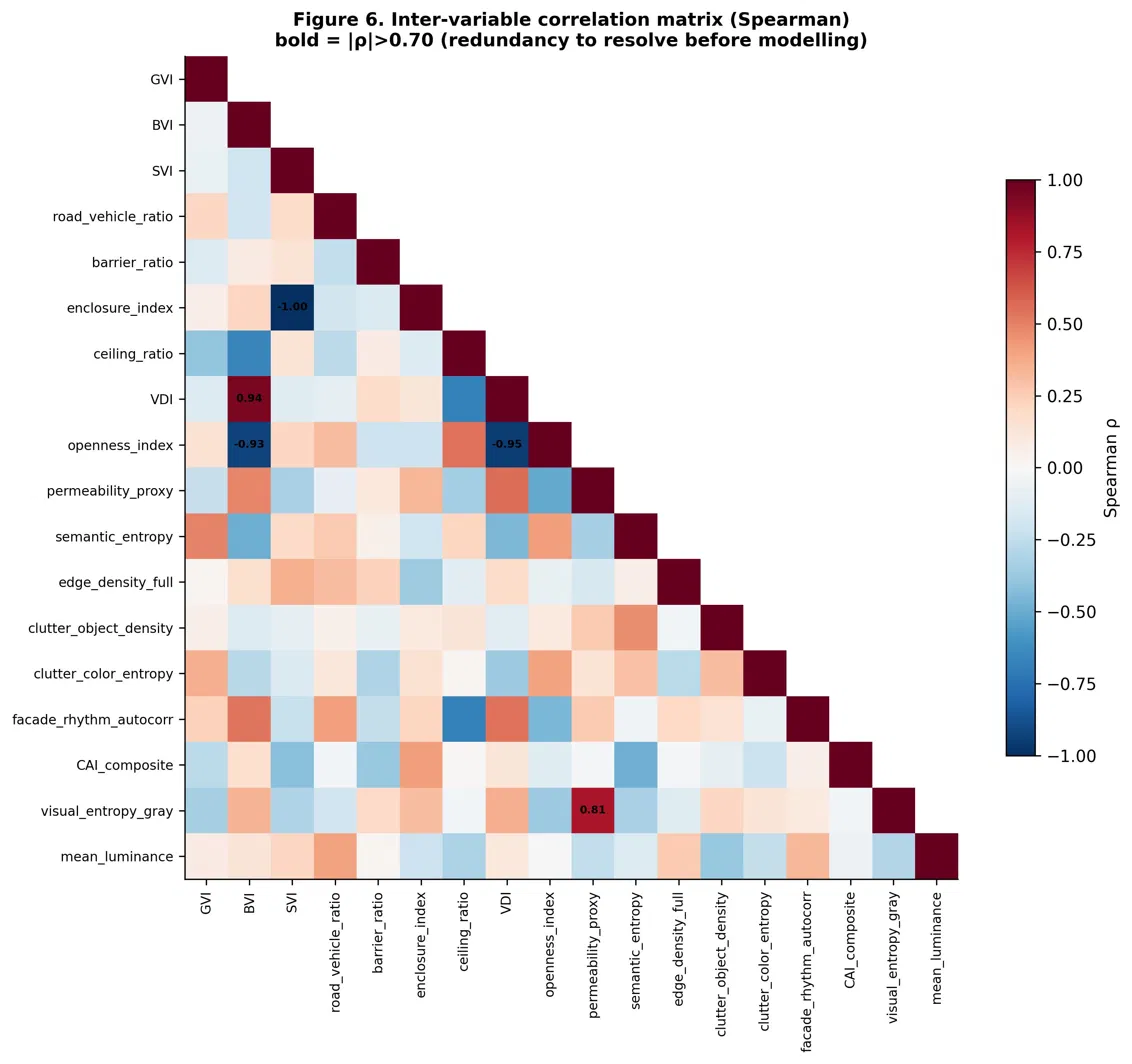
PCA. PC1 (28%) cleanly separates modern from vernacular; PC2 (23%) tracks spatial typology — covered pathways up top, sitting areas below.Redundancy. A few metrics are near-duplicates — enclosure ↔ ceiling (−1.00), openness ↔ VDI (−0.95), VDI ↔ GVI (+0.94) — collapsed before modelling so each variable earns its place.
Measuring the response
Reading the brain's emotional signal.
The accent four (AF3·AF4·F3·F4) sit over the prefrontal cortex — the critical site for frontal alpha asymmetry. CMS/DRL reference & ground sit behind the ears (P3/P4).
A 14-channel EEG headset records brain activity while participants view each estate. Sensor placement decides what we can read — each signal lives over a specific part of the scalp:
Alpha asymmetryfrontal · AF3/AF4 · F3/F4approach vs. withdrawal
The frontal pair (AF3/AF4, F3/F4) over the prefrontal cortex is the critical site — left-vs-right alpha imbalance there is what indexes whether a place pulls a person toward it or pushes them away.
Why timing matters
Data that cannot be collected again.
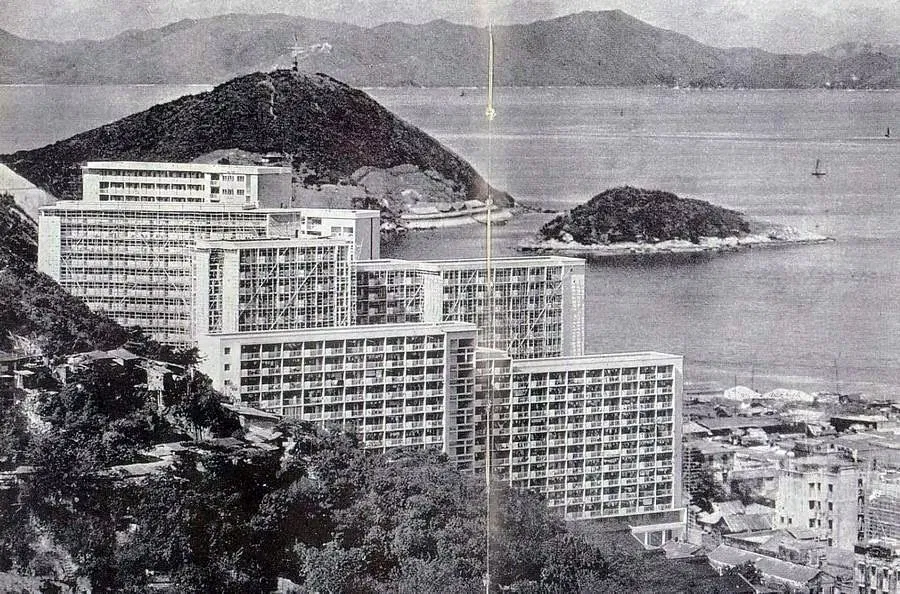
Wah Fu Estate, late 1960s — newly built by the sea.The same old estates today — lived-in, weathered, soon to be cleared.
The 1950s–60s estates — Wah Fu and Sai Wan — are being demolished. Once gone, this visual record can never be recaptured.
Old
Low-rise, open corridors
Inhabited facades
Raw concrete & patina
New
High-rise, enclosed
Clean curtain-wall
Little weathering
Time-critical: Sai Wan clears in 2025–26, Wah Fu from July 2027 — the old estates must be photographed before they are gone.
How the perception survey works
Inside the online experiment.
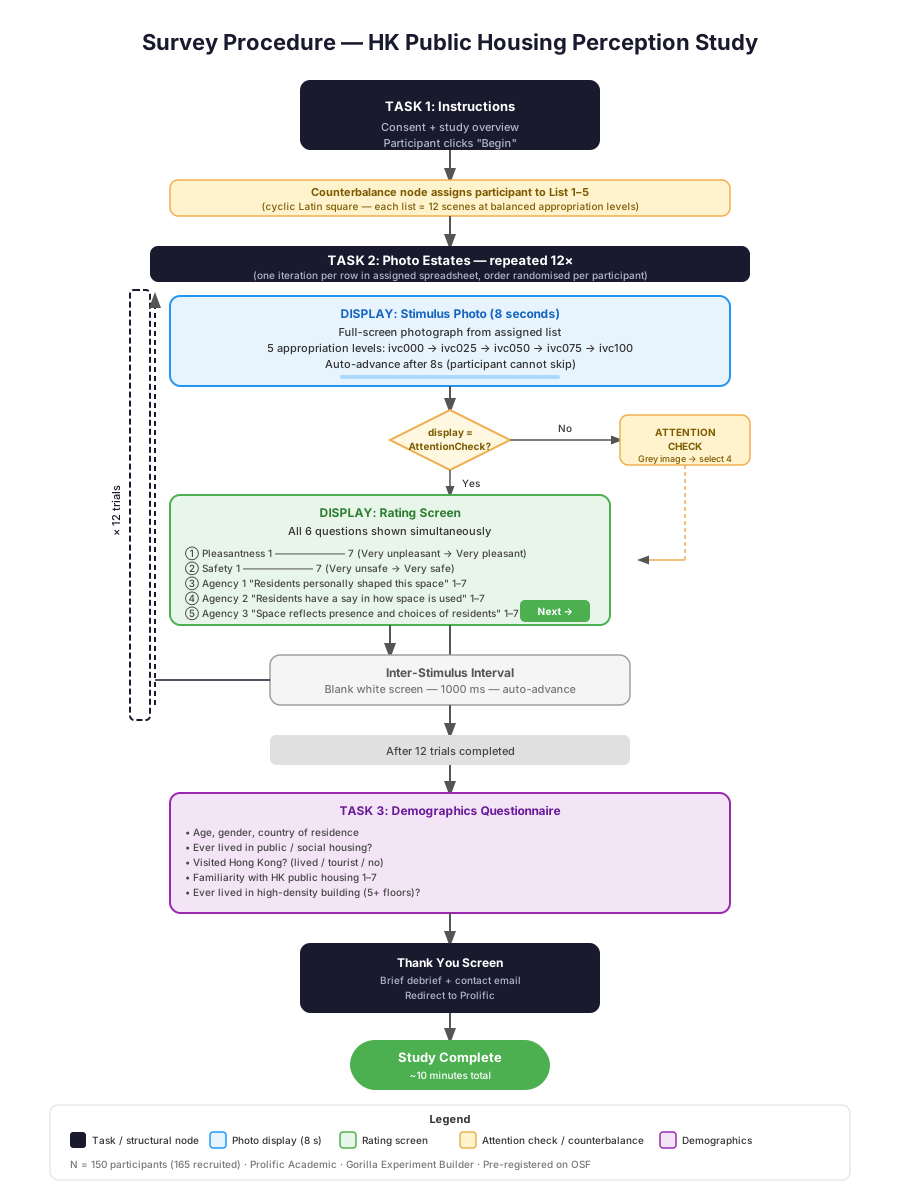
Full procedure — built in Gorilla, run on Prolific, pre-registered on OSF.
Each participant moves through three tasks. The core is a 12-trial loop of photographs, with everything counterbalanced so order and content can’t bias the result.
1
Instructions & consent
Study overview, then a counterbalance node assigns one of 5 stimulus lists (cyclic Latin square).
2
Photo estates — × 12 trials
An 8-second full-screen photo (appropriation levels ivc000→ivc100), then six 1–7 ratings: pleasantness, safety, and resident-agency items. Hidden attention checks throughout.
3
Demographics
Age, residence, housing history, and HK familiarity — then debrief.
150
participants (165 recruited)
12
scenes each
6
ratings per scene
~10min
per session
Preliminary results · pilot behavioural experiment
First behavioural signals from 62 participants.
62
participants completed
60
analysable · QC-passed
720
scene ratings
78%
completion rate
6.3min
median session
Mean pleasantness — epoch × inhabitation level (scale 1–7)
ivc000L0
ivc025L1
ivc050L2
ivc075L3
ivc100L4
Old
3.49
n=70
4.03
n=72
4.43
n=70
peak
4.52
n=77
4.21
n=71
New
4.10
n=71
4.36
n=70
4.53
n=72
4.47
n=70
peak
4.78
n=77
Old estates peak at mid-inhabitation (ivc075 = 4.52) then fall — an inverted-U. New estates instead climb steadily toward full inhabitation (ivc100 = 4.78). The trace of life seems to matter differently in the two eras.
Preliminary results · hypothesis check
What the pilot supports — and what it doesn't.
H1a
Inverted-U in old estates — pleasantness peaks at mid-levels
Peak at ivc075 (4.52) · mid 4.33 > extremes 3.85
Supported
H1b
Inverted-U in new estates
Rises to ivc100 (4.78) — no clear inverted-U
Not supported
H2
Inverted-U for perceived agency across appropriation levels
Climbs to ivc100 (5.62) · mid 4.43 vs extremes 4.11
Not supported
H3
Agency predicts pleasantness — mediation b-path
r = 0.502 Strong positive correlation across n = 720 trials
Supported
H4
Old + high appropriation beats new + low appropriation
Pilot sample · simplified descriptive tests; full mixed-effects models (estate as random effect) to follow with the EEG data.
Preliminary results · cross-cultural (H5)
Does the pattern hold across cultures?
Region
H1a · old U
H1b · new U
H2 · agency U
H3 · mediation
H4 · old>new
North America 27 · 324 trials
✓peak L3
✗peak L4
✗peak L4
✓r 0.55
✗Δ −0.07
Russia 15 · 180 trials
✓peak L3
✓peak L2
✗peak L4
✓r 0.42
✓Δ +0.47
Europe 7 · 84 trials
✗peak L4
✗peak L4
✗peak L4
✓r 0.45
✓Δ +1.18
Asia 6 · 72 trials
✓peak L2
✗peak L4
✗peak L4
✓r 0.55
✗Δ −0.42
Middle East 2 · 24 trials low n
·L1
·L0
·L4
·r 0.32
·Δ +0.17
The old-estate inverted-U (H1a) and the agency→pleasantness link (H3) recur across most regions; the new-estate pattern does not. Regions with < 5 participants are under-powered — read as directional only.
Who this is for
Evidence for a decision being made right now.
Housing policy
Evidence on whether demolition-and-rebuild truly improves how housing feels.
Designers
New housing can be designed to invite traces of life, not erase them.
Researchers
A reusable way to measure inhabited complexity in any city.
Before we demolish, let us look.
Alina Viven Shults · Master of Urban Design · MUDP1004 Midterm Review · HKU